

用Python制作在地图上模拟瘟疫扩散的Gif图

受杰森的《Almost Looks Like Work》启发,我来展示一些病毒传播模型。需要注意的是这个模型并不反映现实情况,因此不要误以为是西非可怕的传染病。相反,它更应该被看做是某种虚构的僵尸爆发现象。那么,让我们进入主题。
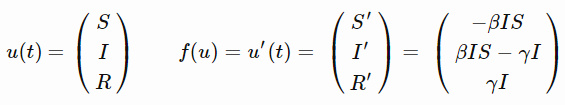
这就是SIR模型,其中字母S、I和R反映的是在僵尸疫情中,个体可能处于的不同状态。
- S 代表易感群体,即健康个体中潜在的可能转变的数量。
- I 代表染病群体,即僵尸数量。
- R 代表移除量,即因死亡而退出游戏的僵尸数量,或者感染后又转回人类的数量。但对与僵尸不存在治愈者,所以我们就不要自我愚弄了(如果要把SIR模型应用到流感传染中,还是有治愈者的)。
- 至于β(beta)和γ(gamma):
- β(beta)表示疾病的传染性程度,只要被咬就会感染。
- γ(gamma)表示从僵尸走向死亡的速率,取决于僵尸猎人的平均工作速率,当然,这不是一个完美的模型,请对我保持耐心。
- S′=?βIS告诉我们健康者变成僵尸的速率,S′是对时间的导数。
- I′=βIS?γI告诉我们感染者是如何增加的,以及行尸进入移除态速率(双关语)。
- R′=γI只是加上(gamma I),这一项在前面的等式中是负的。
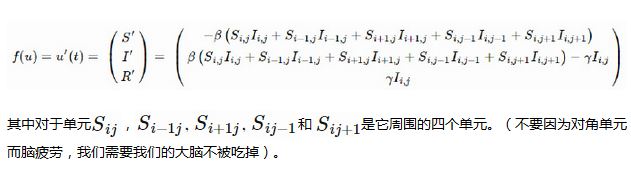
上面的模型没有考虑S/I/R的空间分布,下面来修正一下!
一种方法是把瑞典和北欧国家分割成网格,每个单元可以感染邻近单元,描述如下:
其中对于单元,和是它周围的四个单元。(不要因为对角单元而脑疲劳,我们需要我们的大脑不被吃掉)。
初始化一些东东。
import numpy as np
import math
import matplotlib.pyplot as plt
%matplotlib inline
from matplotlib import rcParams
import matplotlib.image as mpimg
rcParams['font.family'] = 'serif'
rcParams['font.size'] = 16
rcParams['figure.figsize'] = 12, 8
from PIL import Image
适当的beta和gamma值就能够摧毁大半江山
beta = 0.010
gamma = 1
还记得导数的定义么?当导数已知,假设Δt很小的情况下,经过重新整理,它可以用来近似预测函数的下一个取值,我们已经声明过u′(t)。
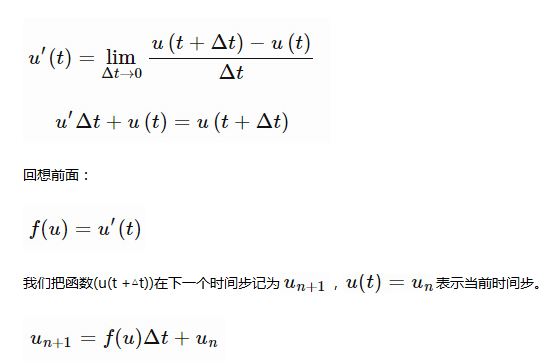
这种方法叫做欧拉法,代码如下:
def euler_step(u, f, dt):
  return u + dt * f(u)
我们需要函数f(u)。友好的numpy提供了简洁的数组操作。我可能会在另一篇文章中回顾它,因为它们太强大了,需要更多的解释,但现在这样就能达到效果:
def f(u):
  S = u[0]
  I = u[1]
  R = u[2]

  new = np.array([-beta*(S[1:-1, 1:-1]*I[1:-1, 1:-1] +
              S[0:-2, 1:-1]*I[0:-2, 1:-1] +
              S[2:, 1:-1]*I[2:, 1:-1] +
              S[1:-1, 0:-2]*I[1:-1, 0:-2] +
              S[1:-1, 2:]*I[1:-1, 2:]),
           beta*(S[1:-1, 1:-1]*I[1:-1, 1:-1] +
              S[0:-2, 1:-1]*I[0:-2, 1:-1] +
              S[2:, 1:-1]*I[2:, 1:-1] +
              S[1:-1, 0:-2]*I[1:-1, 0:-2] +
              S[1:-1, 2:]*I[1:-1, 2:]) - gamma*I[1:-1, 1:-1],
           gamma*I[1:-1, 1:-1]
          ])

  padding = np.zeros_like(u)
  padding[:,1:-1,1:-1] = new
  padding[0][padding[0] < 0] = 0
  padding[0][padding[0] > 255] = 255
  padding[1][padding[1] < 0] = 0
  padding[1][padding[1] > 255] = 255
  padding[2][padding[2] < 0] = 0
  padding[2][padding[2] > 255] = 255

  return padding
导入北欧国家的人口密度图并进行下采样,以便较快地得到结果
from PIL import Image
img = Image.open('popdens2.png')
img = img.resize((img.size[0]/2,img.size[1]/2))
img = 255 - np.asarray(img)
imgplot = plt.imshow(img)
imgplot.set_interpolation('nearest')
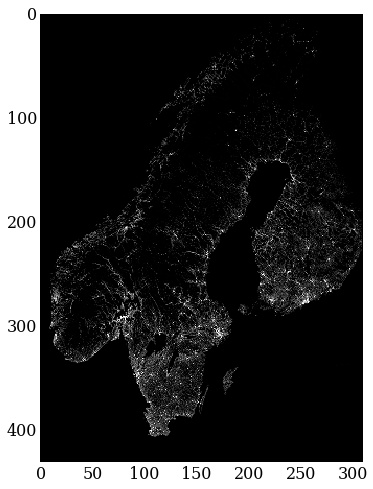
北欧国家的人口密度图(未包含丹麦)
S矩阵,也就是易感个体,应该近似于人口密度。感染者初始值是0,我们把斯德哥尔摩作为第一感染源。
S_0 = img[:,:,1]
I_0 = np.zeros_like(S_0)
I_0[309,170] = 1 # patient zero
因为还没人死亡,所以把矩阵也置为0.
R_0 = np.zeros_like(S_0)
接着初始化模拟时长等。
T = 900             # final time
dt = 1             # time increment
N = int(T/dt) + 1        # number of time-steps
t = np.linspace(0.0, T, N)   # time discretization

# initialize the array containing the solution for each time-step
u = np.empty((N, 3, S_0.shape[0], S_0.shape[1]))
u[0][0] = S_0
u[0][1] = I_0
u[0][2] = R_0
我们需要自定义一个颜色表,这样才能将感染矩阵显示在地图上。
import matplotlib.cm as cm
theCM = cm.get_cmap("Reds")
theCM._init()
alphas = np.abs(np.linspace(0, 1, theCM.N))
theCM._lut[:-3,-1] = alphas
下面坐下来欣赏吧…
for n in range(N-1):
  u[n+1] = euler_step(u[n], f, dt)
让我们再做一下图像渲染,把它做成gif,每个人都喜欢gifs!
from images2gif import writeGif

keyFrames = []
frames = 60.0

for i in range(0, N-1, int(N/frames)):
  imgplot = plt.imshow(img, vmin=0, vmax=255)
  imgplot.set_interpolation("nearest")
  imgplot = plt.imshow(u[i][1], vmin=0, cmap=theCM)
  imgplot.set_interpolation("nearest")
  filename = "outbreak" + str(i) + ".png"
  plt.savefig(filename)
  keyFrames.append(filename)

images = [Image.open(fn) for fn in keyFrames]
gifFilename = "outbreak.gif"
writeGif(gifFilename, images, duration=0.3)
plt.clf()

Hot AI Tools

Undresser.AI Undress
AI-powered app for creating realistic nude photos

AI Clothes Remover
Online AI tool for removing clothes from photos.

Undress AI Tool
Undress images for free

Clothoff.io
AI clothes remover

Video Face Swap
Swap faces in any video effortlessly with our completely free AI face swap tool!

Hot Article
Hot Tools

Notepad++7.3.1
Easy-to-use and free code editor

SublimeText3 Chinese version
Chinese version, very easy to use

Zend Studio 13.0.1
Powerful PHP integrated development environment

Dreamweaver CS6
Visual web development tools

SublimeText3 Mac version
God-level code editing software (SublimeText3)
Hot Topics


 PHP and Python: Different Paradigms Explained
Apr 18, 2025 am 12:26 AM
PHP and Python: Different Paradigms Explained
Apr 18, 2025 am 12:26 AM
PHP is mainly procedural programming, but also supports object-oriented programming (OOP); Python supports a variety of paradigms, including OOP, functional and procedural programming. PHP is suitable for web development, and Python is suitable for a variety of applications such as data analysis and machine learning.
 Choosing Between PHP and Python: A Guide
Apr 18, 2025 am 12:24 AM
Choosing Between PHP and Python: A Guide
Apr 18, 2025 am 12:24 AM
PHP is suitable for web development and rapid prototyping, and Python is suitable for data science and machine learning. 1.PHP is used for dynamic web development, with simple syntax and suitable for rapid development. 2. Python has concise syntax, is suitable for multiple fields, and has a strong library ecosystem.
 Python vs. JavaScript: The Learning Curve and Ease of Use
Apr 16, 2025 am 12:12 AM
Python vs. JavaScript: The Learning Curve and Ease of Use
Apr 16, 2025 am 12:12 AM
Python is more suitable for beginners, with a smooth learning curve and concise syntax; JavaScript is suitable for front-end development, with a steep learning curve and flexible syntax. 1. Python syntax is intuitive and suitable for data science and back-end development. 2. JavaScript is flexible and widely used in front-end and server-side programming.
 PHP and Python: A Deep Dive into Their History
Apr 18, 2025 am 12:25 AM
PHP and Python: A Deep Dive into Their History
Apr 18, 2025 am 12:25 AM
PHP originated in 1994 and was developed by RasmusLerdorf. It was originally used to track website visitors and gradually evolved into a server-side scripting language and was widely used in web development. Python was developed by Guidovan Rossum in the late 1980s and was first released in 1991. It emphasizes code readability and simplicity, and is suitable for scientific computing, data analysis and other fields.
 Can vs code run in Windows 8
Apr 15, 2025 pm 07:24 PM
Can vs code run in Windows 8
Apr 15, 2025 pm 07:24 PM
VS Code can run on Windows 8, but the experience may not be great. First make sure the system has been updated to the latest patch, then download the VS Code installation package that matches the system architecture and install it as prompted. After installation, be aware that some extensions may be incompatible with Windows 8 and need to look for alternative extensions or use newer Windows systems in a virtual machine. Install the necessary extensions to check whether they work properly. Although VS Code is feasible on Windows 8, it is recommended to upgrade to a newer Windows system for a better development experience and security.
 Can visual studio code be used in python
Apr 15, 2025 pm 08:18 PM
Can visual studio code be used in python
Apr 15, 2025 pm 08:18 PM
VS Code can be used to write Python and provides many features that make it an ideal tool for developing Python applications. It allows users to: install Python extensions to get functions such as code completion, syntax highlighting, and debugging. Use the debugger to track code step by step, find and fix errors. Integrate Git for version control. Use code formatting tools to maintain code consistency. Use the Linting tool to spot potential problems ahead of time.
 How to run programs in terminal vscode
Apr 15, 2025 pm 06:42 PM
How to run programs in terminal vscode
Apr 15, 2025 pm 06:42 PM
In VS Code, you can run the program in the terminal through the following steps: Prepare the code and open the integrated terminal to ensure that the code directory is consistent with the terminal working directory. Select the run command according to the programming language (such as Python's python your_file_name.py) to check whether it runs successfully and resolve errors. Use the debugger to improve debugging efficiency.
 Is the vscode extension malicious?
Apr 15, 2025 pm 07:57 PM
Is the vscode extension malicious?
Apr 15, 2025 pm 07:57 PM
VS Code extensions pose malicious risks, such as hiding malicious code, exploiting vulnerabilities, and masturbating as legitimate extensions. Methods to identify malicious extensions include: checking publishers, reading comments, checking code, and installing with caution. Security measures also include: security awareness, good habits, regular updates and antivirus software.
