

How to use scatter plots to display data in Highcharts


How to use scatter charts to display data in Highcharts
Preface
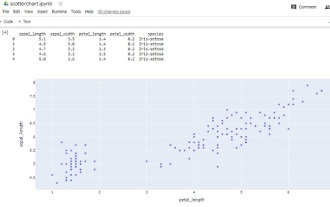
Highcharts is an open source JavaScript chart library that provides rich chart types and powerful customization functions. Among them, scatter plot is a commonly used data visualization method that can show the relationship between two variables and the distribution of variables. This article will introduce how to use scatter plots to display data in Highcharts and provide specific code examples.
Step 1: Import the Highcharts library file
First, you need to introduce the Highcharts library file into the HTML file. These files can be imported by using CDN, the code is as follows:
<!DOCTYPE html>
<html>
<head>
  <script src="https://cdn.jsdelivr.net/npm/highcharts@8.2.2/highcharts.js"></script>
</head>
<body>
  <div id="container"></div>
</body>
</html>
Step 2: Prepare data
Before using the scatter plot, you need to prepare a set of data. The data can be a two-dimensional array. Each element contains two values, representing the coordinates of the horizontal axis and the vertical axis. The sample data is as follows:
var data = [
  [1, 5],
  [2, 10],
  [3, 15],
  [4, 20],
  [5, 25]
];
Step 3: Create a scatter plot
Next , use the API of the Highcharts library to create scatter plots. A configuration object needs to be passed in to specify the parameters of the chart. The sample code is as follows:
Highcharts.chart('container', {
  chart: {
    type: 'scatter'
  },
  title: {
    text: '散点图'
  },
  xAxis: {
    title: {
      text: '横轴标题'
    }
  },
  yAxis: {
    title: {
      text: '纵轴标题'
    }
  },
  series: [{
    name: '散点数据',
    data: data
  }]
});In the above code, we specified the chart type as scatter (scatter chart) and set the title, horizontal axis and vertical axis. The title of the axis. By passing in the data array, we plot the data in a scatter plot.
Step 4: Configure other options
Highcharts provides a wealth of options and configurations that can be used to further customize the style and interaction of charts. The following are some commonly used options:
- Color: You can specify the color of the scatter points by setting the color property of the series object.
- Size: You can specify the size of the scatter points by setting the marker attribute of the series object.
- Label: You can add scatter point labels by setting the dataLabels property of the series object.
Highcharts.chart('container', {
  chart: {
    type: 'scatter'
  },
  title: {
    text: '散点图'
  },
  xAxis: {
    title: {
      text: '横轴标题'
    }
  },
  yAxis: {
    title: {
      text: '纵轴标题'
    }
  },
  series: [{
    name: '散点数据',
    data: data,
    color: 'blue',
    marker: {
      symbol: 'circle',
      radius: 5
    },
    dataLabels: {
      enabled: true,
      format: '{point.y}',
      style: {
        color: 'black'
      }
    }
  }]
});The above code sets the color of the scatter points to blue, sets the size to a circle with a radius of 5, and adds data labels to the scatter points.
Conclusion
This article introduces how to use scatter plots to display data in Highcharts, and provides specific code examples. By introducing Highcharts library files, preparing data, creating scatter plots, and configuring other options, you can flexibly customize and display data. I hope this article will be helpful to you when drawing scatter plots using Highcharts.
The above is the detailed content of How to use scatter plots to display data in Highcharts. For more information, please follow other related articles on the PHP Chinese website!

Hot AI Tools

Undresser.AI Undress
AI-powered app for creating realistic nude photos

AI Clothes Remover
Online AI tool for removing clothes from photos.

Undress AI Tool
Undress images for free

Clothoff.io
AI clothes remover

Video Face Swap
Swap faces in any video effortlessly with our completely free AI face swap tool!

Hot Article
Hot Tools

Notepad++7.3.1
Easy-to-use and free code editor

SublimeText3 Chinese version
Chinese version, very easy to use

Zend Studio 13.0.1
Powerful PHP integrated development environment

Dreamweaver CS6
Visual web development tools

SublimeText3 Mac version
God-level code editing software (SublimeText3)
Hot Topics


 How to use Sankey chart to display data in Highcharts
Dec 17, 2023 pm 04:41 PM
How to use Sankey chart to display data in Highcharts
Dec 17, 2023 pm 04:41 PM
How to use Sankey diagram to display data in Highcharts Sankey diagram (SankeyDiagram) is a chart type used to visualize complex processes such as flow, energy, and funds. It can clearly display the relationship and flow between various nodes, and can help us better understand and analyze data. In this article, we will introduce how to use Highcharts to create and customize a Sankey chart, with specific code examples. First, we need to load the Highcharts library and Sank
 How to make a basic scatter plot using Python-Plotly?
Aug 31, 2023 pm 01:37 PM
How to make a basic scatter plot using Python-Plotly?
Aug 31, 2023 pm 01:37 PM
Sometimes the task is to analyze a data set and visualize the data using charts or plots. Plotly is a great open source graphics library that can be used with Python for making a variety of plots and charts quickly and easily. In this article, using two different examples, a Python library called Plotly is used with Python code to plot a scatter plot. In the first example, the Python installed in the computer system is used to run a Python program written to make a scatter plot. Another example, using Google Colab, shows how you can still use Python and Plotly and make scatter plots without Python installed on your computer. In these two
 How to use dynamic data in Highcharts to display real-time data
Dec 17, 2023 pm 06:57 PM
How to use dynamic data in Highcharts to display real-time data
Dec 17, 2023 pm 06:57 PM
How to use dynamic data in Highcharts to display real-time data. With the advent of the big data era, the display of real-time data has become more and more important. Highcharts, as a popular charting library, provides rich functions and customizability, allowing us to flexibly display real-time data. This article will introduce how to use dynamic data in Highcharts to display real-time data, and give specific code examples. First, we need to prepare a data source that can provide real-time data. In this article, I
 How to create a Gantt chart using Highcharts
Dec 17, 2023 pm 07:23 PM
How to create a Gantt chart using Highcharts
Dec 17, 2023 pm 07:23 PM
How to use Highcharts to create a Gantt chart requires specific code examples. Introduction: The Gantt chart is a chart form commonly used to display project progress and time management. It can visually display the start time, end time and progress of the task. Highcharts is a powerful JavaScript chart library that provides rich chart types and flexible configuration options. This article will introduce how to use Highcharts to create a Gantt chart and give specific code examples. 1. Highchart
 How to use stacked charts to display data in Highcharts
Dec 18, 2023 pm 05:56 PM
How to use stacked charts to display data in Highcharts
Dec 18, 2023 pm 05:56 PM
How to use stacked charts to display data in Highcharts Stacked charts are a common way of visualizing data, which can display the sum of multiple data series at the same time and display the contribution of each data series in the form of a bar chart. Highcharts is a powerful JavaScript library that provides a rich variety of charts and flexible configuration options to meet various data visualization needs. In this article, we will introduce how to use Highcharts to create a stacked chart and provide
 Implementation of area chart and scatter chart functions of Vue statistical chart
Aug 20, 2023 am 11:58 AM
Implementation of area chart and scatter chart functions of Vue statistical chart
Aug 20, 2023 am 11:58 AM
The area chart and scatter chart functions of Vue statistical charts are implemented. With the continuous development of data visualization technology, statistical charts play an important role in data analysis and display. Under the Vue framework, we can use the existing chart library and combine it with Vue's two-way data binding and componentization features to easily implement the functions of area charts and scatter charts. This article will introduce how to use Vue and commonly used chart libraries to implement these two statistical charts. Implementation of area charts Area charts are often used to show the trend of data changes over time. In Vue, we can use v
 How to use histogram to display data in ECharts
Dec 18, 2023 pm 02:21 PM
How to use histogram to display data in ECharts
Dec 18, 2023 pm 02:21 PM
How to use histograms to display data in ECharts ECharts is a JavaScript-based data visualization library that is very popular and widely used in the field of data visualization. Among them, the histogram is the most common and commonly used chart type, which can be used to display the size, comparison and trend analysis of various numerical data. This article will introduce how to use ECharts to draw histograms and provide code examples. First, we need to introduce the ECharts library into the HTML file, which can be introduced in the following way
 How to create a map heat map using Highcharts
Dec 17, 2023 pm 04:06 PM
How to create a map heat map using Highcharts
Dec 17, 2023 pm 04:06 PM
How to use Highcharts to create a map heat map requires specific code examples. A heat map is a visual data display method that can represent the data distribution in each area through different color shades. In the field of data visualization, Highcharts is a very popular JavaScript library that provides rich chart types and interactive functions. This article will introduce how to use Highcharts to create a map heat map and provide specific code examples. First, we need to prepare some data
