

How to implement Gantt chart drawing in Python?

Preliminary preparation
Because we need to use the streamlit, streamlit-aggrid and plotly modules this time, first pass the The pip command downloads these modules, of which streamlit-aggrid is mainly used to present the data table on the page
pip install streamlit-aggrid
pip install plotly
The structure of the page
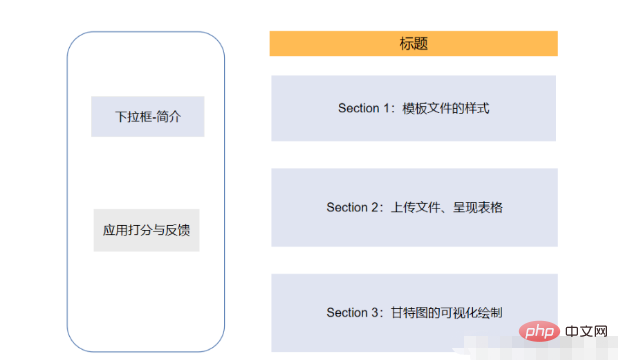
The overall page The structure is that there is a toolbar on the left, which contains some brief introductions to the web page, and a module that hopes users to rate and give feedback
. Section1 on the right is the template style of the project planning document, mainly in CSV Write clearly the details of the task in the file, including task name, task description, start and end time, etc. Section2 allows users to upload their own CSV files, modify the content of the items in the CSV file and provide a visual presentation, while Section3 exports the above content to an HTML file.
Code part
The following is the code part of the page
from st_aggrid import AgGrid
import streamlit as st
import pandas as pd
import numpy as np
import plotly.express as px
from  PIL import Image
import io
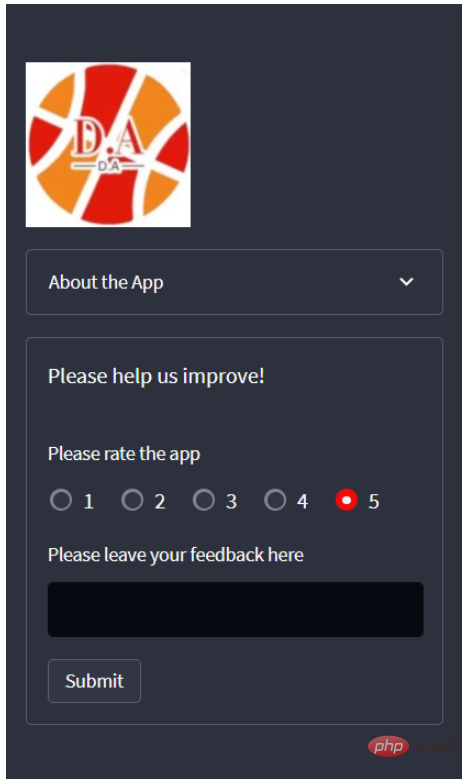
Next we will develop the part of the toolbar on the left, mainly to provide a simple introduction to the page and scoring functions
logo = Image.open(r'wechat_logo.jpg')
st.sidebar.image(logo, width=120)
with st.sidebar.expander("关于此APP的功能"):
st.write("""
项目的简单介绍)
""")
with st.sidebar.form(key='columns_in_form',clear_on_submit=True):
st.write('反馈')
st.write('<style>div.row-widget.stRadio > div{flex-direction:row;} </style>', unsafe_allow_html=True) # 水平方向的按钮
rating=st.radio("打分",('1','2','3','4','5'),index=4)
text=st.text_input(label='反馈')
submitted = st.form_submit_button('提交')
if submitted:
st.write('感谢')
st.markdown('您的评分是:')
st.markdown(rating)
st.markdown('您的反馈是:')
st.markdown(text)The results are shown in the figure below
Development of the main page-Section 1
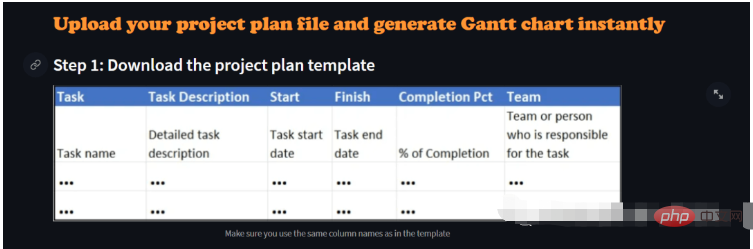
The next step is the development of Section 1 of the main page, mainly for display The style of the project CSV file, which columns it contains, what the column names are, etc., the code is as follows
st.markdown(""" <style> .font {
font-size:30px ; font-family: 'Cooper Black'; color: #FF9633;}
</style> """, unsafe_allow_html=True)
st.markdown('<p class="font">上传您的CSV文件</p>', unsafe_allow_html=True)
st.subheader('第一步:下载模板文件')
image = Image.open(r'example.png') # 模板文件的截图
st.image(image, caption='确保列名是一致的')
@st.cache_data
def convert_df(df):
return df.to_csv().encode('utf-8')
df=pd.read_csv(r'template.csv', encoding='gbk')
csv = convert_df(df)
st.download_button(
label="下载模板",
data=csv,
file_name='project_template.csv',
mime='text/csv',
)We provide a download button that allows users to download the template file with one click, and the final appearance is like this
Development of home page -Section 2
The next step is to upload our own CSV file, here we use the streamlit_aggrid module , the advantage of this module is that it can display the data table and modify the data in it,
st.subheader('Step 2: Upload your project plan file')
uploaded_file = st.file_uploader(
    "上传文件",
    type=['csv'])
if uploaded_file is not None:
    Tasks = pd.read_csv(uploaded_file, encoding='gbk')
    Tasks['Start'] = Tasks['Start'].astype('datetime64')
    Tasks['Finish'] = Tasks['Finish'].astype('datetime64')

    grid_response = AgGrid(
        Tasks,
        editable=True,
        height=300,
        width='100%',
    )

    updated = grid_response['data']
df = pd.DataFrame(updated)output
Next It is a visual presentation of data. Here we use the Plotly module to draw a Gantt chart. We can choose to draw it based on the team's dimension or the progress of the project completion. The code is as follows
st.subheader('第三部:绘制甘特图')

Options = st.selectbox("以下面哪种维度来绘制甘特图:", ['Team', 'Completion Pct'], index=0)
if st.button('绘制甘特图'):
    fig = px.timeline(
        df,
        x_start="Start",
        x_end="Finish",
        y="Task",
        color=Options,
        hover_name="Task Description"
    )

    fig.update_yaxes(
        autorange="reversed")

    fig.update_layout(
        title='Project Plan Gantt Chart',
        bargap=0.2,
        height=600,
        xaxis_title="Date",
        yaxis_title="Project Name",
        title_x=0.5,
        xaxis=dict(
            tickfont_size=15,
            tickangle=270,
            rangeslider_visible=True,
            side="top",
            showgrid=True,
            zeroline=True,
            showline=True,
            showticklabels=True,
            tickformat="%x\n",
        )
    )

    fig.update_xaxes(tickangle=0, tickfont=dict(family='Rockwell', color='blue', size=15))
    st.plotly_chart(fig, use_container_width=True)  # 绘制甘特图至页面上
    st.subheader(
        'Bonus: 导出至HTML')
    buffer = io.StringIO()
    fig.write_html(buffer, include_plotlyjs='cdn')
    html_bytes = buffer.getvalue().encode()
    st.download_button(
        label='Export to HTML',
        data=html_bytes,
        file_name='Gantt.html',
        mime='text/html'
    )
else:
st.write('---')The above is the detailed content of How to implement Gantt chart drawing in Python?. For more information, please follow other related articles on the PHP Chinese website!

Hot AI Tools

Undresser.AI Undress
AI-powered app for creating realistic nude photos

AI Clothes Remover
Online AI tool for removing clothes from photos.

Undress AI Tool
Undress images for free

Clothoff.io
AI clothes remover

Video Face Swap
Swap faces in any video effortlessly with our completely free AI face swap tool!

Hot Article
Hot Tools

Notepad++7.3.1
Easy-to-use and free code editor

SublimeText3 Chinese version
Chinese version, very easy to use

Zend Studio 13.0.1
Powerful PHP integrated development environment

Dreamweaver CS6
Visual web development tools

SublimeText3 Mac version
God-level code editing software (SublimeText3)
Hot Topics


 PHP and Python: Different Paradigms Explained
Apr 18, 2025 am 12:26 AM
PHP and Python: Different Paradigms Explained
Apr 18, 2025 am 12:26 AM
PHP is mainly procedural programming, but also supports object-oriented programming (OOP); Python supports a variety of paradigms, including OOP, functional and procedural programming. PHP is suitable for web development, and Python is suitable for a variety of applications such as data analysis and machine learning.
 Choosing Between PHP and Python: A Guide
Apr 18, 2025 am 12:24 AM
Choosing Between PHP and Python: A Guide
Apr 18, 2025 am 12:24 AM
PHP is suitable for web development and rapid prototyping, and Python is suitable for data science and machine learning. 1.PHP is used for dynamic web development, with simple syntax and suitable for rapid development. 2. Python has concise syntax, is suitable for multiple fields, and has a strong library ecosystem.
 Python vs. JavaScript: The Learning Curve and Ease of Use
Apr 16, 2025 am 12:12 AM
Python vs. JavaScript: The Learning Curve and Ease of Use
Apr 16, 2025 am 12:12 AM
Python is more suitable for beginners, with a smooth learning curve and concise syntax; JavaScript is suitable for front-end development, with a steep learning curve and flexible syntax. 1. Python syntax is intuitive and suitable for data science and back-end development. 2. JavaScript is flexible and widely used in front-end and server-side programming.
 Can vs code run in Windows 8
Apr 15, 2025 pm 07:24 PM
Can vs code run in Windows 8
Apr 15, 2025 pm 07:24 PM
VS Code can run on Windows 8, but the experience may not be great. First make sure the system has been updated to the latest patch, then download the VS Code installation package that matches the system architecture and install it as prompted. After installation, be aware that some extensions may be incompatible with Windows 8 and need to look for alternative extensions or use newer Windows systems in a virtual machine. Install the necessary extensions to check whether they work properly. Although VS Code is feasible on Windows 8, it is recommended to upgrade to a newer Windows system for a better development experience and security.
 PHP and Python: A Deep Dive into Their History
Apr 18, 2025 am 12:25 AM
PHP and Python: A Deep Dive into Their History
Apr 18, 2025 am 12:25 AM
PHP originated in 1994 and was developed by RasmusLerdorf. It was originally used to track website visitors and gradually evolved into a server-side scripting language and was widely used in web development. Python was developed by Guidovan Rossum in the late 1980s and was first released in 1991. It emphasizes code readability and simplicity, and is suitable for scientific computing, data analysis and other fields.
 Can visual studio code be used in python
Apr 15, 2025 pm 08:18 PM
Can visual studio code be used in python
Apr 15, 2025 pm 08:18 PM
VS Code can be used to write Python and provides many features that make it an ideal tool for developing Python applications. It allows users to: install Python extensions to get functions such as code completion, syntax highlighting, and debugging. Use the debugger to track code step by step, find and fix errors. Integrate Git for version control. Use code formatting tools to maintain code consistency. Use the Linting tool to spot potential problems ahead of time.
 How to run programs in terminal vscode
Apr 15, 2025 pm 06:42 PM
How to run programs in terminal vscode
Apr 15, 2025 pm 06:42 PM
In VS Code, you can run the program in the terminal through the following steps: Prepare the code and open the integrated terminal to ensure that the code directory is consistent with the terminal working directory. Select the run command according to the programming language (such as Python's python your_file_name.py) to check whether it runs successfully and resolve errors. Use the debugger to improve debugging efficiency.
 Is the vscode extension malicious?
Apr 15, 2025 pm 07:57 PM
Is the vscode extension malicious?
Apr 15, 2025 pm 07:57 PM
VS Code extensions pose malicious risks, such as hiding malicious code, exploiting vulnerabilities, and masturbating as legitimate extensions. Methods to identify malicious extensions include: checking publishers, reading comments, checking code, and installing with caution. Security measures also include: security awareness, good habits, regular updates and antivirus software.
