
 Backend Development
Python Tutorial
Introducing the common drawing functions of python's matplotlib
Backend Development
Python Tutorial
Introducing the common drawing functions of python's matplotlib
Introducing the common drawing functions of python's matplotlib


Free learning recommendation: python video tutorial
matplotlib has powerful drawing functions, But the sentences are trivial, and it would be too troublesome to write them sentence by sentence every time they are used. This article summarizes common drawing functions based on daily drawing experience, which can be used directly and is very convenient
import matplotlib.pyplot as pltimport pandas as pdimport numpy as np
plt.rcParams['font.sans-serif']=['simhei']#用于正常显示中文标签plt.rcParams['axes.unicode_minus']=False#用于正常显示负号
1. Draw using DataFrame tables containing multiple columns of data
def plot_cols(data,xlabel=None,ylabel=None,path_file=None,marker=True,len_xticks=10,save=False):
    """
    :param data:DataFrame,数据表格--行标题为横坐标,列标题为数据列
                Series,序列——行标题为横坐标,name为数据列
    :param xlabel: str,横坐标名称
    :param ylabel: str,纵坐标名称
    :param path_file: str,保存文件路径
    :param marker: bool,是否为每条线添加不同的标记
    :param len_xticks:int,横坐标显示的值个数
    :param save: bool,是否保存图片
    example:
        data=pd.DataFrame(np.random.random((100,3)),index=np.arange(100),columns=['a','b','c'])
        plot_cols(data,xlabel='指标',ylabel='指数')
    """
    data.index=data.index.astype(str)
    plt.figure(figsize=(12,8))
    markers=['.',',','o','v','^','','1','2','3','4','s','p','*','h','H','+','x','D','d','|','_']#标记符号

    #如果是DataFrame表格形式,则画出多列;如果是Series,则画出单列
    if type(data) is pd.core.frame.DataFrame:
        #是否为每条线添加不同的符号
        if marker==False:
            for col in data.columns:
                plt.plot(data[col],marker='o',label=col)
        else:
            for col,marker_ in zip(data.columns,markers):
                plt.plot(data[col], marker=marker_, label=col)

    elif type(data) is pd.core.series.Series:
        plt.plot(data, marker='o', label=data.name)

    plt.legend(loc='best',fontsize='small')
    xticks=np.linspace(0,len(data),(len_xticks+1)).astype(int).tolist()[:-1]#被显示的横坐标刻度值的位置
    plt.xticks(data.index[xticks],rotation=270)
    plt.ylabel(ylabel,fontsize=15)
    plt.xlabel(xlabel,fontsize=15)
    plt.grid(True,alpha=0.2)
    if save==True:plt.savefig(path_file)if __name__=='__main__':
    x=np.arange(1,101)
    data = pd.DataFrame({'a':x*2+3,'b':x*3-4,'c':np.log(x)+9}, index=np.arange(100))
    plot_cols(data, xlabel='指标', ylabel='指数')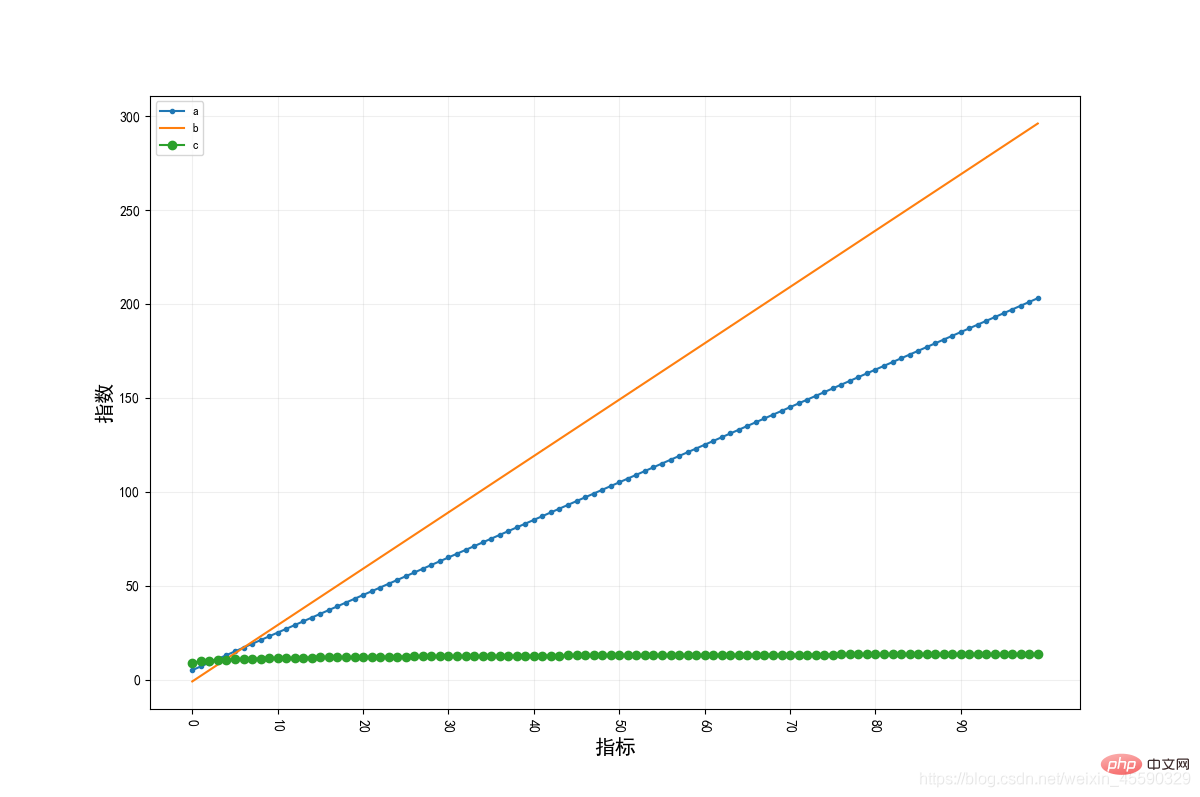
2. Convert the DataFrame table data containing two columns into a dual-axis chart
def plot_twins(data,col1,col2,xlabel=None,ylabel1=None,ylabel2=None,len_xticks=10,figsize=(10,6),save_path=None):
    """将含有两列的DataFrame表格数据作为双轴图
    :param data: DataFrame,含有两列的DataFrame表格数据
    :param col1: str,左图列标题
    :param col2: str,右图列标题
    :param xlabel: str,横轴标题
    :param ylabel1: str,左y轴标题
    :param ylabel2: str,右y轴标题
    :param len_xticks: int,显示的刻度个数
    :param figsize: turple,图大小
    :param save_path: str,图片保存路径。默认为None,不保存图片
    :return:
    example:
        x=np.arange(0,100)
        data=pd.DataFrame({'销售额(元)':3*x+np.random.random(100)*100,'增长率(%)':np.random.random(100)},index=pd.date_range('2015-01-23',periods=100,freq='D'))
        plot_twins(data,col1='销售额(元)',col2='增长率(%)',xlabel=None,ylabel1='销售额(元)',ylabel2='增长率(%)')
    """
    fig=plt.figure(figsize=figsize)#创建一块总画布
    # 将画板分为四行四列共16个单元格,(0, 0)表示从第一行第一列即第一个单元格开始画图,将第一行的三个单元格作为一个画块作画
    ax=plt.subplot2grid((1,1),(0,0),rowspan=1,colspan=1)

    plt.plot(data[col1],label=col1,color='r',marker='^')
    ax.legend(loc='upper right')#用于显示画布ax的图,切记用 loc= 表示位置
    ax.set_ylabel(ylabel1)
    xticks=np.linspace(0,len(data),(len_xticks+1)).astype(int).tolist()[:-1]#被显示的横坐标刻度值的位置
    ax.set_xticks(data.index[xticks])
    plt.xticks(rotation=270)

    twin=ax.twinx()
    plt.plot(data[col2],label=col2,color='y',marker='o')
    twin.legend(loc='upper left')
    twin.set_ylabel(ylabel2)
    ax.set_xlabel(xlabel)
    ax.grid(True,alpha=0.2)
    if save_path!=None: plt.savefig(save_path)if __name__=='__main__':
        x=np.arange(0,100)
        data=pd.DataFrame({'销售额(元)':3*x+np.random.random(100)*100,'增长率(%)':np.random.random(100)},index=pd.date_range('2015-01-23',periods=100,freq='D'))
        plot_twins(data,col1='销售额(元)',col2='增长率(%)',xlabel=None,ylabel1='销售额(元)',ylabel2='增长率(%)')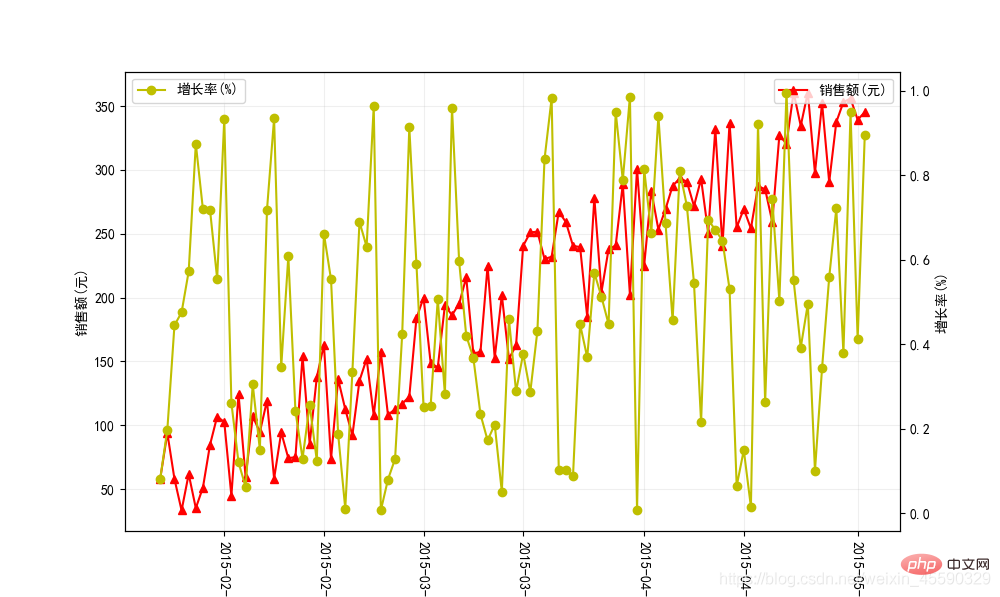
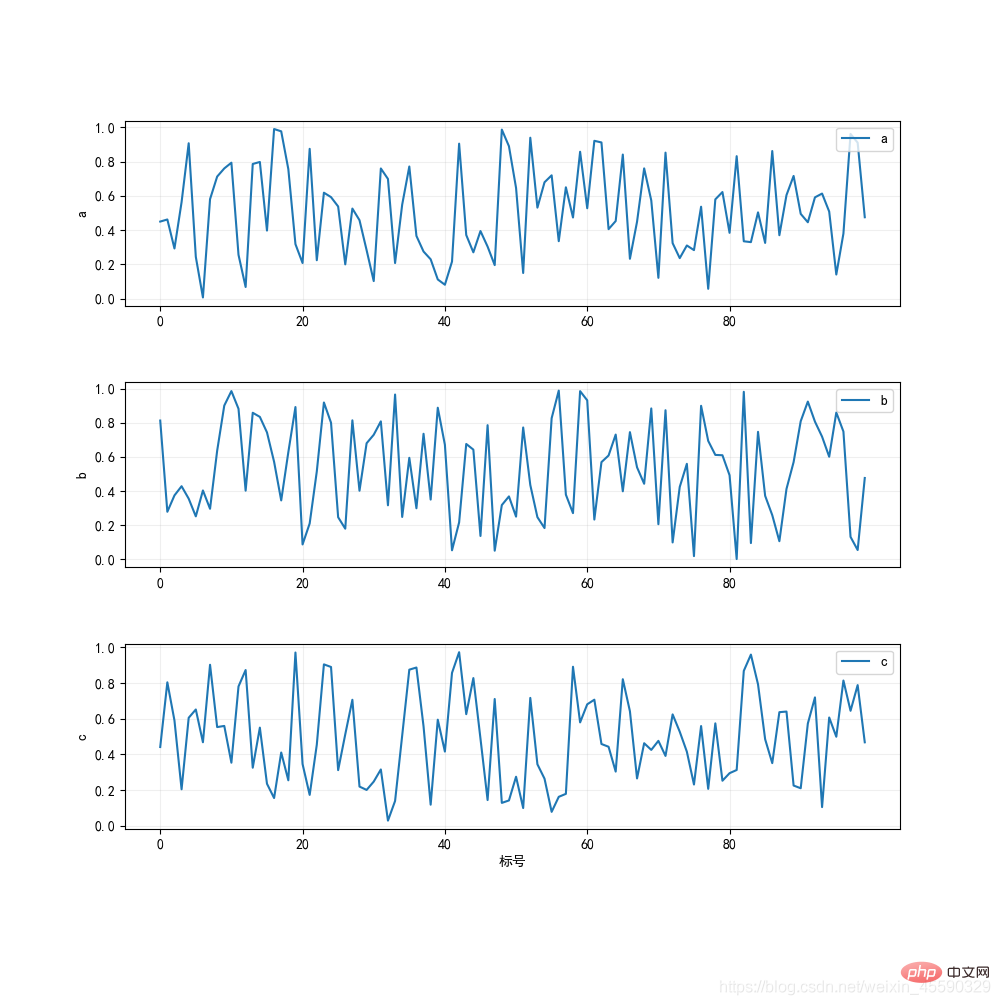
3. Convert the DataFrame Multiple columns of data in the table are drawn into multiple graphs
def plot_figs(data,xlabel=None,ylabels=None,save_path=None,len_xticks=5,length=10,width=3,intervals=1):
    """
    将DataFrame表格中的多列数据绘制成多个图
    :param data:DataFrame,含有多列的表格
    :param xlabel:str,横轴标题
    :param ylabels:list,各个图的纵轴标题
    :param path_save:str,图片保存路径。默认为None,不保存图片
    :param len_xticks: int,显示的刻度个数
    :param length:int,画板长度
    :param width:int,图画宽度
    :param intervals:int,图画之间间隔距离
    :return:
    example:
        data=pd.DataFrame(np.random.random((100,3)),index=np.arange(100),columns=['a','b','c'])
        plot_figs(data,xlabel='标号',ylabels=['a','b','c'])
    """

    cols=data.columns
    num_fig = len(data.columns)
    fig = plt.figure(figsize=(length, 4*num_fig))  # 创建一块总画布
    for i in range(0,num_fig):
        #i=2

        ax = plt.subplot2grid((num_fig*(width+intervals), 1), (i*(width+intervals), 0), rowspan=width,
                               colspan=1)  # 将画板分为四行四列共16个单元格,(0, 0)表示从第一行第一列即第一个单元格开始画图,将第一行的三个单元格作为一个画块作画

        ax.plot(data[cols[i]], label=cols[i])
        ax.legend(loc='upper right')  # 用于显示画布ax1的图,切记用 loc= 表示位置
        if ylabels!=None:ax.set_ylabel(ylabels[i])
        if xlabels!=None and i==(num_fig-1):ax.set_xlabel(xlabel)
        xticks = np.linspace(0, len(data), (len_xticks + 1)).astype(int).tolist()[:-1]  # 被显示的横坐标刻度值的位置
        ax.set_xticks(data.index[xticks])
        plt.grid(True,alpha=0.2)
    if save_path != None: plt.savefig(save_path)if __name__=='__main__':
    data=pd.DataFrame(np.random.random((100,3)),index=np.arange(100),columns=['a','b','c'])
    plot_figs(data,xlabel='标号',ylabels=['a','b','c'])
##Related free learning recommendations: python tutorial(video)
The above is the detailed content of Introducing the common drawing functions of python's matplotlib. For more information, please follow other related articles on the PHP Chinese website!

Hot AI Tools

Undresser.AI Undress
AI-powered app for creating realistic nude photos

AI Clothes Remover
Online AI tool for removing clothes from photos.

Undress AI Tool
Undress images for free

Clothoff.io
AI clothes remover

Video Face Swap
Swap faces in any video effortlessly with our completely free AI face swap tool!

Hot Article
Hot Tools

Notepad++7.3.1
Easy-to-use and free code editor

SublimeText3 Chinese version
Chinese version, very easy to use

Zend Studio 13.0.1
Powerful PHP integrated development environment

Dreamweaver CS6
Visual web development tools

SublimeText3 Mac version
God-level code editing software (SublimeText3)
Hot Topics


 PHP and Python: Different Paradigms Explained
Apr 18, 2025 am 12:26 AM
PHP and Python: Different Paradigms Explained
Apr 18, 2025 am 12:26 AM
PHP is mainly procedural programming, but also supports object-oriented programming (OOP); Python supports a variety of paradigms, including OOP, functional and procedural programming. PHP is suitable for web development, and Python is suitable for a variety of applications such as data analysis and machine learning.
 Choosing Between PHP and Python: A Guide
Apr 18, 2025 am 12:24 AM
Choosing Between PHP and Python: A Guide
Apr 18, 2025 am 12:24 AM
PHP is suitable for web development and rapid prototyping, and Python is suitable for data science and machine learning. 1.PHP is used for dynamic web development, with simple syntax and suitable for rapid development. 2. Python has concise syntax, is suitable for multiple fields, and has a strong library ecosystem.
 Python vs. JavaScript: The Learning Curve and Ease of Use
Apr 16, 2025 am 12:12 AM
Python vs. JavaScript: The Learning Curve and Ease of Use
Apr 16, 2025 am 12:12 AM
Python is more suitable for beginners, with a smooth learning curve and concise syntax; JavaScript is suitable for front-end development, with a steep learning curve and flexible syntax. 1. Python syntax is intuitive and suitable for data science and back-end development. 2. JavaScript is flexible and widely used in front-end and server-side programming.
 Can vs code run in Windows 8
Apr 15, 2025 pm 07:24 PM
Can vs code run in Windows 8
Apr 15, 2025 pm 07:24 PM
VS Code can run on Windows 8, but the experience may not be great. First make sure the system has been updated to the latest patch, then download the VS Code installation package that matches the system architecture and install it as prompted. After installation, be aware that some extensions may be incompatible with Windows 8 and need to look for alternative extensions or use newer Windows systems in a virtual machine. Install the necessary extensions to check whether they work properly. Although VS Code is feasible on Windows 8, it is recommended to upgrade to a newer Windows system for a better development experience and security.
 Can visual studio code be used in python
Apr 15, 2025 pm 08:18 PM
Can visual studio code be used in python
Apr 15, 2025 pm 08:18 PM
VS Code can be used to write Python and provides many features that make it an ideal tool for developing Python applications. It allows users to: install Python extensions to get functions such as code completion, syntax highlighting, and debugging. Use the debugger to track code step by step, find and fix errors. Integrate Git for version control. Use code formatting tools to maintain code consistency. Use the Linting tool to spot potential problems ahead of time.
 PHP and Python: A Deep Dive into Their History
Apr 18, 2025 am 12:25 AM
PHP and Python: A Deep Dive into Their History
Apr 18, 2025 am 12:25 AM
PHP originated in 1994 and was developed by RasmusLerdorf. It was originally used to track website visitors and gradually evolved into a server-side scripting language and was widely used in web development. Python was developed by Guidovan Rossum in the late 1980s and was first released in 1991. It emphasizes code readability and simplicity, and is suitable for scientific computing, data analysis and other fields.
 How to run programs in terminal vscode
Apr 15, 2025 pm 06:42 PM
How to run programs in terminal vscode
Apr 15, 2025 pm 06:42 PM
In VS Code, you can run the program in the terminal through the following steps: Prepare the code and open the integrated terminal to ensure that the code directory is consistent with the terminal working directory. Select the run command according to the programming language (such as Python's python your_file_name.py) to check whether it runs successfully and resolve errors. Use the debugger to improve debugging efficiency.
 Is the vscode extension malicious?
Apr 15, 2025 pm 07:57 PM
Is the vscode extension malicious?
Apr 15, 2025 pm 07:57 PM
VS Code extensions pose malicious risks, such as hiding malicious code, exploiting vulnerabilities, and masturbating as legitimate extensions. Methods to identify malicious extensions include: checking publishers, reading comments, checking code, and installing with caution. Security measures also include: security awareness, good habits, regular updates and antivirus software.
