

Detailed explanation of Innodb status

|
Innodb_buffer_pool_pages_data The number of pages containing data in the Innodb buffer pool cache pool, including dirty pages. The unit is page. Innodb_buffer_pool_pages_dirty The number of dirty pages in the innodb buffer pool cache pool. The unit is page. Innodb_buffer_pool_pages_flushed The number of flush page requests in the innodb buffer pool cache pool. The unit is page. Innodb_buffer_pool_pages_free The number of pages remaining in the innodb buffer pool. The unit is page. Innodb_buffer_pool_pages_misc The number of pages in the innodb buffer pool buffer pool that are currently used for management purposes or hash index and cannot be used as ordinary data pages . The unit is page. Innodb_buffer_pool_pages_total ##The total number of pages in the innodb buffer pool. The unit is page. Innodb_buffer_pool_read_ahead The number of pages read by the backend read-ahead thread into the innodb buffer pool. The unit is page. Innodb_buffer_pool_read_ahead_evicted The number of pages read in advance, but the number of pages that are replaced from the buffer pool without being read, generally used To judge the efficiency of pre-reading. Innodb_buffer_pool_read_requests The number of logical reads performed by innodb. The unit is times. Innodb_buffer_pool_reads The number of times a single page read cannot be obtained from the buffer pool when performing logical reads. The unit is times. Innodb_buffer_pool_wait_free Writing to the InnoDB buffer pool usually occurs in the background, but it is necessary to read or create pages when there are no clean pages. It is necessary to wait for the page to be refreshed first. The number of times Innodb's IO thread needs to wait for free pages when it reads data from the data file and writes it to the buffer pool. The unit is times. Innodb_buffer_pool_write_requests The number of writes to the InnoDB buffer pool. The unit is times. Innodb_data_fsyncs The number of fsync() operations performed by innodb. The unit is times. Innodb_data_pending_fsyncs The number of fsync() operations currently pending in innodb. The unit is times. Innodb_data_pending_reads The number of read operations currently pending in innodb. The unit is times. Innodb_data_pending_writes inndoThe number of currently pending write operations. The unit is times. Innodb_data_read The total amount of data read by innodb. The unit is bytes. Innodb_data_reads The total number of innodb data reads. The unit is times. Innodb_data_writes The total number of innodb data writes. The unit is times. Innodb_data_written The total amount of data written by innodb. The unit is bytes. Innodb_dblwr_pages_written The total number of doublewrite pages that innodb has completed. The unit is page. Innodb_dblwr_writes The total number of doublewrites that innodb has completed. The unit is times. Innodb_log_waits The number of waits caused by having to wait for the log cache to be written because it is too small. The unit is times. Innodb_log_write_requests The number of innodb log write requests. The unit is times. Innodb_log_writes The total number of times innodb log buffer writes to log file. The unit is times. Innodb_os_log_fsyncs The total number of fsync() performed on the innodb log buffer. The unit is times. Innodb_os_log_pending_fsyncs The current number of pending fsync log files. The unit is times. Innodb_os_log_pending_writes The number of currently pending write log files. The unit is times. Innodb_os_log_written The number of bytes written to the log file. The unit is bytes. Innodb_page_size Compiled InnoDB page size (default 16KB). Innodb_pages_created The total number of pages in innodb. The unit is page. Innodb_pages_read The total number of pages read by innodb. The unit is page. Innodb_pages_written The total number of pages written by innodb. The unit is page. Innodb_row_lock_current_waits The number of row locks that innodb is currently waiting for. The unit is a. Innodb_row_lock_time The total time spent by innodb to acquire row locks. The unit is milliseconds. Innodb_row_lock_time_avg The average time innodb waits to obtain a row lock. The unit is milliseconds. Innodb_row_lock_time_max The maximum waiting time for innodb to acquire a row lock. The unit is milliseconds. Innodb_row_lock_waits The number of times innodb waits to acquire a row lock. The unit is times. Innodb_rows_deleted The number of rows deleted from the innodb table. The unit is row. Innodb_rows_inserted The number of rows inserted into the innodb table. The unit is row. Innodb_rows_updated The number of updated rows in the innodb table. The unit is row |
The above is the detailed content of Detailed explanation of Innodb status. For more information, please follow other related articles on the PHP Chinese website!

Hot AI Tools

Undresser.AI Undress
AI-powered app for creating realistic nude photos

AI Clothes Remover
Online AI tool for removing clothes from photos.

Undress AI Tool
Undress images for free

Clothoff.io
AI clothes remover

Video Face Swap
Swap faces in any video effortlessly with our completely free AI face swap tool!

Hot Article
Hot Tools

Notepad++7.3.1
Easy-to-use and free code editor

SublimeText3 Chinese version
Chinese version, very easy to use

Zend Studio 13.0.1
Powerful PHP integrated development environment

Dreamweaver CS6
Visual web development tools

SublimeText3 Mac version
God-level code editing software (SublimeText3)
Hot Topics


 Connection status in standby: Disconnected, reason: NIC Compliance
Feb 19, 2024 pm 03:15 PM
Connection status in standby: Disconnected, reason: NIC Compliance
Feb 19, 2024 pm 03:15 PM
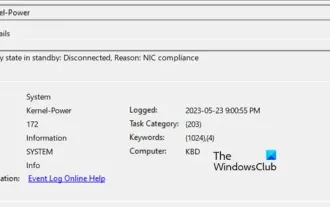
"The connection status in the event log message shows Standby: Disconnected due to NIC compliance. This means that the system is in standby mode and the network interface card (NIC) has been disconnected. Although this is usually a network issue , but can also be caused by software and hardware conflicts. In the following discussion, we will explore how to solve this problem." What is the reason for standby connection disconnection? NIC compliance? If you see the "ConnectivityStatusinStandby:DisConnected,Reason:NICCompliance" message in Windows Event Viewer, this indicates that there may be a problem with your NIC or network interface controller. This situation is usually
 What is the analysis of 2.8k screen?
Jan 02, 2024 pm 12:21 PM
What is the analysis of 2.8k screen?
Jan 02, 2024 pm 12:21 PM
We often see the introduction of how many K screens we have when buying TVs, computers or mobile phones, such as 2.8K screens. At this time, there will be friends who don’t know much about electronic devices and will be curious about what this 2.8K screen means and what the resolution is. What does 2.8k screen mean? Answer: 2.8k screen means that the screen resolution is 2880*18002K, which means the number of horizontal pixels is greater than 2000. For the same size screen, the higher the resolution, the better the picture quality. Introduction to resolution 1. Since the points, lines and surfaces on the screen are all composed of pixels, the more pixels the monitor can display, the finer the picture, and the more information can be displayed in the same screen area. 2. The higher the resolution, the greater the number of pixels, and the sharper the sensed image.
 How to set Momo status
Mar 01, 2024 pm 12:10 PM
How to set Momo status
Mar 01, 2024 pm 12:10 PM
Momo, a well-known social platform, provides users with a wealth of functional services for their daily social interactions. On Momo, users can easily share their life status, make friends, chat, etc. Among them, the setting status function allows users to show their current mood and status to others, thereby attracting more people's attention and communication. So how to set your own Momo status? The following will give you a detailed introduction! How to set status on Momo? 1. Open Momo, click More in the lower right corner, find and click Daily Status. 2. Select the status. 3. The setting status will be displayed.
 How to check server status
Oct 09, 2023 am 10:10 AM
How to check server status
Oct 09, 2023 am 10:10 AM
Methods to view server status include command line tools, graphical interface tools, monitoring tools, log files, and remote management tools. Detailed introduction: 1. Use command line tools. On Linux or Unix servers, you can use command line tools to view the status of the server; 2. Use graphical interface tools. For server operating systems with graphical interfaces, you can use the graphics provided by the system. Use interface tools to view server status; 3. Use monitoring tools. You can use special monitoring tools to monitor server status in real time, etc.
 How to show up offline on WhatsApp on Android phone
Jul 14, 2023 am 08:21 AM
How to show up offline on WhatsApp on Android phone
Jul 14, 2023 am 08:21 AM
Want to appear "offline" or don't want to share your current status with your friends on WhatsApp? There is a simple but clever trick to do this. You can adjust your WhatsApp settings so that your current status (offline or last seen) is not visible to your friends or others there. How to show offline status on your WhatsApp status bar? This is a very simple and streamlined process. So, follow the steps below now. Step 1 – Open WhatsApp on your phone. Step 2 – Tap ⋮ and choose to open Settings. Step 3 – Open Privacy settings to access it. Step 4 – On that privacy page, open the “Last Viewed & Online” setting to access it. Step 5 – Change the “Who can
 what is mysql innodb
Apr 14, 2023 am 10:19 AM
what is mysql innodb
Apr 14, 2023 am 10:19 AM
InnoDB is one of the database engines of MySQL. It is now the default storage engine of MySQL and one of the standards for binary releases by MySQL AB. InnoDB adopts a dual-track authorization system, one is GPL authorization and the other is proprietary software authorization. InnoDB is the preferred engine for transactional databases and supports transaction security tables (ACID); InnoDB supports row-level locks, which can support concurrency to the greatest extent. Row-level locks are implemented by the storage engine layer.
 How MySQL sees InnoDB row format from binary content
Jun 03, 2023 am 09:55 AM
How MySQL sees InnoDB row format from binary content
Jun 03, 2023 am 09:55 AM
InnoDB is a storage engine that stores data in tables on disk, so our data will still exist even after shutdown and restart. The actual process of processing data occurs in memory, so the data in the disk needs to be loaded into the memory. If it is processing a write or modification request, the contents in the memory also need to be refreshed to the disk. And we know that the speed of reading and writing to disk is very slow, which is several orders of magnitude different from reading and writing in memory. So when we want to get certain records from the table, does the InnoDB storage engine need to read the records from the disk one by one? The method adopted by InnoDB is to divide the data into several pages, and use pages as the basic unit of interaction between disk and memory. The size of a page in InnoDB is generally 16
 Detailed explanation of the five states of Java threads and state transition rules
Feb 19, 2024 pm 05:03 PM
Detailed explanation of the five states of Java threads and state transition rules
Feb 19, 2024 pm 05:03 PM
In-depth understanding of the five states of Java threads and their conversion rules 1. Introduction to the five states of threads In Java, the life cycle of a thread can be divided into five different states, including new state (NEW), ready state (RUNNABLE), Running status (RUNNING), blocking status (BLOCKED) and termination status (TERMINATED). New state (NEW): When the thread object is created, it is in the new state. At this point, the thread object has allocated enough resources to perform the task
