

Forecast in Excel: linear and exponential smoothing forecasting models

This tutorial demonstrates how to perform time series forecasting in Excel using both the built-in Forecast Sheet feature and custom formulas. Excel offers several forecasting methods, and this guide covers two key approaches: exponential smoothing and linear regression.
- Exponential Smoothing
- Using the Forecast Sheet
- Manual Exponential Smoothing Formulas
- Linear Regression Forecasting
- Linear Forecast Formulas
- Creating a Linear Regression Chart
Understanding Excel Forecasting
Forecasting uses historical data to predict future trends. It's valuable for tasks like budgeting, sales projections, and cash flow analysis. Remember, forecasts provide probabilities, not certainties; always review results critically before making decisions. Excel provides tools including built-in functions, features, and charting capabilities.
Exponential Smoothing in Excel
Excel's exponential smoothing utilizes the AAA version (additive error, additive trend, additive seasonality) of the Exponential Triple Smoothing (ETS) algorithm. This method smooths data by identifying seasonal patterns and confidence intervals, making it ideal for non-linear data with recurring patterns (available in Excel 2016, 2019, and Office 365).
Automated Exponential Forecasting with the Forecast Sheet
The Forecast Sheet (introduced in Excel 2016) simplifies time series forecasting. Organize your data correctly, and Excel handles the calculations.
Data Preparation
Prepare two adjacent columns:
- Time Series: Sequentially observed dates or times (hourly, daily, monthly, etc.) at regular intervals. Consistent intervals are crucial. While the tool can handle up to 30% missing data or duplicate dates, summarizing data for accuracy is recommended.
- Data Values: Corresponding numerical values to be predicted.
Example: Forecasting sales based on historical monthly data (Note: Column A uses a custom format showing month and year, but the underlying data is date values, not text).

Creating the Forecast
- Select both data series (selecting one cell often automatically selects the entire series).
- Navigate to the Data tab > Forecast group and click Forecast Sheet.

- In the Create Forecast Worksheet window, choose your chart type (line or column) and specify the forecast end date. Click Create.


Excel generates a new sheet with a table of original and predicted values, along with a chart.

Examine the formulas in the forecast sheet or refer to the section on Exponential Smoothing Formulas for details on the calculations.
Customizing the Forecast
Access forecast options by clicking Options in the Create Forecast Worksheet window:

Adjust settings like:
- Forecast Start: Start date for predictions (consider starting before the last historical point for seasonal data or to compare predictions with known values).
- Confidence Interval: Prediction range (default is 95%).
- Seasonality: Length of seasonal cycles (Excel auto-detects, but manual input is possible).
- Include Forecast Statistics: Displays statistical information (smoothing constants, error metrics).
- Timeline Range & Values Range: Data ranges for time series and values.
- Fill Missing Points Using: Handles missing data points (interpolation or zeros).
- Duplicate Aggregates Using: Handles multiple values with the same timestamp (average, median, etc.).
Manual Exponential Smoothing Formulas
The Forecast Sheet uses the FORECAST.ETS and FORECAST.ETS.CONFINT functions.
Forecasted Values (FORECAST.ETS)
Syntax: FORECAST.ETS(target_date, values, timeline, [seasonality], [data_completion], [aggregation])
Example: =FORECAST.ETS(A31, $B$2:$B$30, $A$2:$A$30, 1, 1)
Confidence Interval (FORECAST.ETS.CONFINT)
Syntax: FORECAST.ETS.CONFINT(target_date, values, timeline, confidence_level, [seasonality], [data_completion], [aggregation])
Example: =FORECAST.ETS.CONFINT(A31, $B$2:$B$30, $A$2:$A$30, 0.95, 1, 1)
Confidence bounds are calculated by adding and subtracting the confidence interval from the forecast value.


Linear Regression Forecasting
Linear regression is suitable for data lacking seasonality or with insufficient data for detecting it. Excel offers FORECAST (older versions) and FORECAST.LINEAR (Excel 2016 and later) functions. Both have identical functionality.
Linear Forecast Formulas
Example (using FORECAST.LINEAR): =FORECAST.LINEAR(A14, $B$2:$B$13, $A$2:$A$13)

Linear Regression Chart
Create a line chart combining the historical and forecasted data for a visual representation. Remember to copy the last historical data point to maintain a continuous line.

This comprehensive guide empowers you to leverage Excel's forecasting capabilities effectively. For a practical demonstration, download the sample workbook (link provided in original text).
The above is the detailed content of Forecast in Excel: linear and exponential smoothing forecasting models. For more information, please follow other related articles on the PHP Chinese website!

Hot AI Tools

Undresser.AI Undress
AI-powered app for creating realistic nude photos

AI Clothes Remover
Online AI tool for removing clothes from photos.

Undress AI Tool
Undress images for free

Clothoff.io
AI clothes remover

Video Face Swap
Swap faces in any video effortlessly with our completely free AI face swap tool!

Hot Article
Hot Tools

Notepad++7.3.1
Easy-to-use and free code editor

SublimeText3 Chinese version
Chinese version, very easy to use

Zend Studio 13.0.1
Powerful PHP integrated development environment

Dreamweaver CS6
Visual web development tools

SublimeText3 Mac version
God-level code editing software (SublimeText3)
Hot Topics
 1663
1663
 14
1420
52
1315
25
1266
29
1239
24
14
1420
52
1315
25
1266
29
1239
24

 MEDIAN formula in Excel - practical examples
Apr 11, 2025 pm 12:08 PM
MEDIAN formula in Excel - practical examples
Apr 11, 2025 pm 12:08 PM
This tutorial explains how to calculate the median of numerical data in Excel using the MEDIAN function. The median, a key measure of central tendency, identifies the middle value in a dataset, offering a more robust representation of central tenden
 Excel shared workbook: How to share Excel file for multiple users
Apr 11, 2025 am 11:58 AM
Excel shared workbook: How to share Excel file for multiple users
Apr 11, 2025 am 11:58 AM
This tutorial provides a comprehensive guide to sharing Excel workbooks, covering various methods, access control, and conflict resolution. Modern Excel versions (2010, 2013, 2016, and later) simplify collaborative editing, eliminating the need to m
 Google Spreadsheet COUNTIF function with formula examples
Apr 11, 2025 pm 12:03 PM
Google Spreadsheet COUNTIF function with formula examples
Apr 11, 2025 pm 12:03 PM
Master Google Sheets COUNTIF: A Comprehensive Guide This guide explores the versatile COUNTIF function in Google Sheets, demonstrating its applications beyond simple cell counting. We'll cover various scenarios, from exact and partial matches to han
 Excel: Group rows automatically or manually, collapse and expand rows
Apr 08, 2025 am 11:17 AM
Excel: Group rows automatically or manually, collapse and expand rows
Apr 08, 2025 am 11:17 AM
This tutorial demonstrates how to streamline complex Excel spreadsheets by grouping rows, making data easier to analyze. Learn to quickly hide or show row groups and collapse the entire outline to a specific level. Large, detailed spreadsheets can be
 Excel: If cell contains formula examples
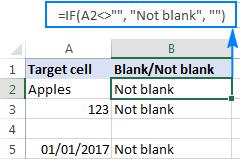
Apr 09, 2025 am 09:04 AM
Excel: If cell contains formula examples
Apr 09, 2025 am 09:04 AM
This tutorial demonstrates various Excel formulas to check if a cell contains specific values, including text, numbers, or parts of strings. It covers scenarios using IF, ISTEXT, ISNUMBER, SEARCH, FIND, COUNTIF, EXACT, SUMPRODUCT, VLOOKUP, and neste
 How to convert Excel to JPG - save .xls or .xlsx as image file
Apr 11, 2025 am 11:31 AM
How to convert Excel to JPG - save .xls or .xlsx as image file
Apr 11, 2025 am 11:31 AM
This tutorial explores various methods for converting .xls files to .jpg images, encompassing both built-in Windows tools and free online converters. Need to create a presentation, share spreadsheet data securely, or design a document? Converting yo
 Google sheets chart tutorial: how to create charts in google sheets
Apr 11, 2025 am 09:06 AM
Google sheets chart tutorial: how to create charts in google sheets
Apr 11, 2025 am 09:06 AM
This tutorial shows you how to create various charts in Google Sheets, choosing the right chart type for different data scenarios. You'll also learn how to create 3D and Gantt charts, and how to edit, copy, and delete charts. Visualizing data is cru
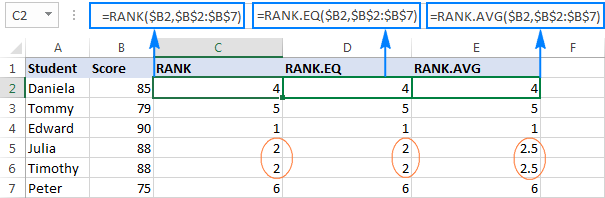 Excel RANK function and other ways to calculate rank
Apr 09, 2025 am 11:35 AM
Excel RANK function and other ways to calculate rank
Apr 09, 2025 am 11:35 AM
This Excel tutorial details the nuances of the RANK functions and demonstrates how to rank data in Excel based on multiple criteria, group data, calculate percentile rank, and more. Determining the relative position of a number within a list is easi
