
 Backend Development
Python Tutorial
Code Your Diagrams: Automate Architecture with Python&#s Diagrams Library
Backend Development
Python Tutorial
Code Your Diagrams: Automate Architecture with Python&#s Diagrams Library
Code Your Diagrams: Automate Architecture with Python&#s Diagrams Library

Introduction
In the realm of modern infrastructure, where cloud services and microservices reign supreme, managing and visualizing complex architectures is more critical than ever.
Gone are the days of manually creating and updating architecture diagrams. With the Diagrams Python library, you can generate dynamic, code-driven diagrams that evolve alongside your infrastructure. A few lines of Python are all it takes to visualize cloud architectures, network topologies, or microservice interactions. Diagrams ensure your system documentation stays accurate and up-to-date, whether you’re managing multi-cloud deployments, Kubernetes clusters, or on-premise solutions. It’s an effortless way to keep your architecture in sync with your codebase.
In this post, we'll explore the capabilities of the Diagrams library, showcase how to create High-Level Designs (HLDs) for cloud infrastructure, and automate the process of creating architecture diagrams.
Why Use Diagrams Python Library?
- Automation: Generate architecture diagrams directly from your code, ensuring they stay up-to-date with the evolving system.
- Programmatic Control: Diagrams allows you to define your infrastructure visually with Python, offering fine control over how elements are represented.
- Supports Multiple Cloud Providers: The library supports AWS, Azure, GCP, and on-premise systems, making it a versatile tool for visualizing multi-cloud and hybrid architectures.
- Scalable: From small projects to large distributed systems, Diagrams can handle various levels of complexity.
Supported Providers
- OnPrem
- AWS
- Azure
- GCP
- IBM
- Kubernetes (K8s)
- AlibabaCloud
- OCI (Oracle Cloud Infrastructure)
- OpenStack
- Firebase
- DigitalOcean
- Elastic
- Outscale
- Generic
- Programming
- SaaS
- C4 Model
- Custom
Getting Started with Diagrams
To get started with Diagrams, you’ll need to install the library and set up your environment.
Step 0: Prerequisites
To create diagrams using the Diagrams Python library on MacOS/Windows, you'll need to install Graphviz first. Graphviz is the tool that the Diagrams library uses to generate the visual representations of your infrastructure.
- Mac
If you're on macOS, the easiest way to install Graphviz is using Homebrew:
brew install graphviz
- Windows
If you're on Windows, follow the below steps
- Download the Graphviz installer from the official website Graphviz Download Page.
- Run the installer and follow the installation steps.
- During installation, make sure to check the option that adds Graphviz to your system’s PATH.
Step 1: Installation
brew install graphviz
Step 2: Your First Diagram
Let’s create a simple diagram that represents a basic web architecture on AWS.
pip install diagrams
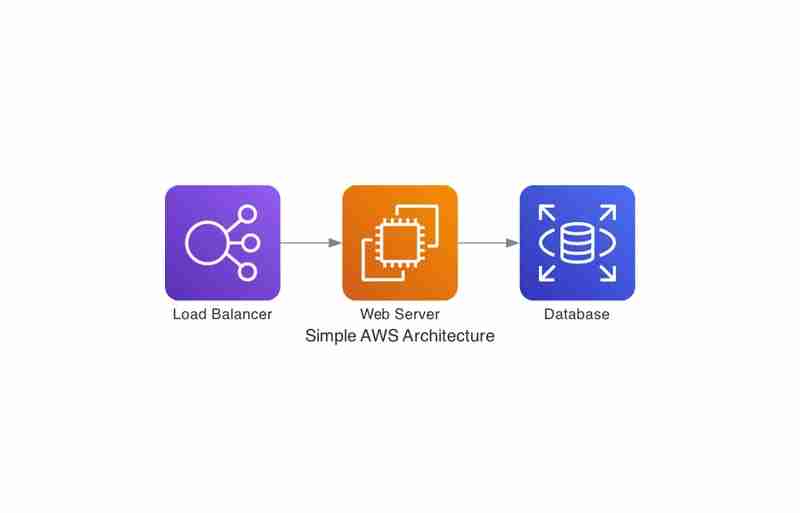
With this minimal code, you can visualize how traffic flows from the Load Balancer to the Web Server, and then to the Database. That’s the power of the Diagrams library: it's quick, intuitive, and highly customizable. And this is just the beginning—there are many more advanced features and components you can leverage, which we'll explore in the following sections.
Advanced Features
Grouping Components (Clustering)
You can group components into clusters to represent different tiers or logical groupings within your architecture.
from diagrams import Diagram
from diagrams.aws.compute import EC2
from diagrams.aws.network import ELB
from diagrams.aws.database import RDS

with Diagram("Simple AWS Architecture", show=False):
    lb = ELB("Load Balancer")
    web = EC2("Web Server")
    db = RDS("Database")

    lb >> web >> db
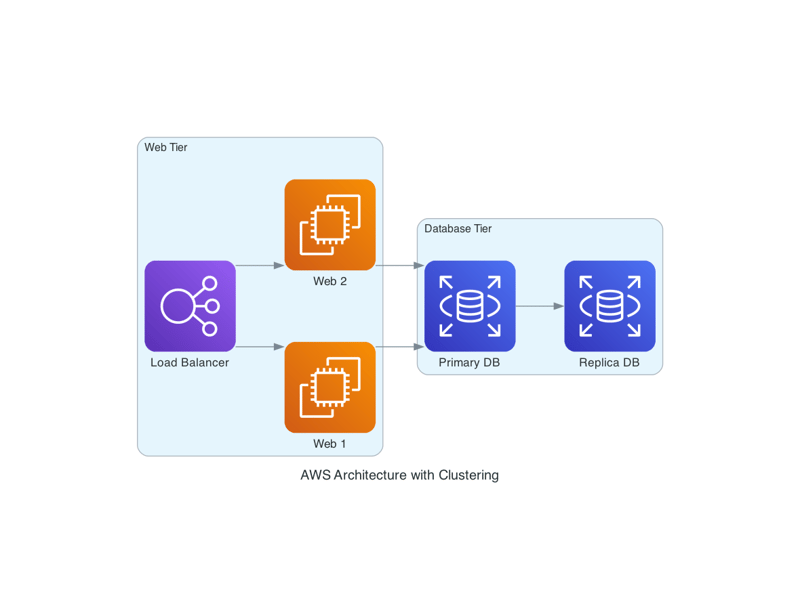
We use Cluster() to group web servers and databases, making the diagram easier to understand by visualizing tiers separately.
Customizing Components
Diagrams allow you to add custom labels, colors, and even custom images to represent specific components. For example, if you want to represent a custom service, you can include external images from local or even from remote.
- Using a Custom Icon from a Local Source
If you have an icon saved locally (for example, a custom_icon.png file), you can use it to represent your custom component in the diagram. The code below shows how to add a custom icon from your local filesystem.
from diagrams import Cluster, Diagram
from diagrams.aws.compute import EC2
from diagrams.aws.network import ELB
from diagrams.aws.database import RDS

with Diagram("AWS Architecture with Clustering", show=False):
    with Cluster("Web Tier"):
        lb = ELB("Load Balancer")
        web_servers = [EC2("Web 1"), EC2("Web 2")]

    with Cluster("Database Tier"):
        db_primary = RDS("Primary DB")
        db_replica = RDS("Replica DB")

    lb >> web_servers >> db_primary
    db_primary >> db_replica
./custom_icon.png is the path to your local image file.

- Using a Custom Icon from a Remote Source
Similarly, you can use an image from a remote source. Here's how you can download an image from a URL and use it in your diagram.
You can also use custom icons from a remote URL by giving the remote path to the files.
from diagrams.custom import Custom
with Diagram("Custom Service Architecture", show=False):
    custom_service = Custom("My Custom Service", "./custom_icon.png")
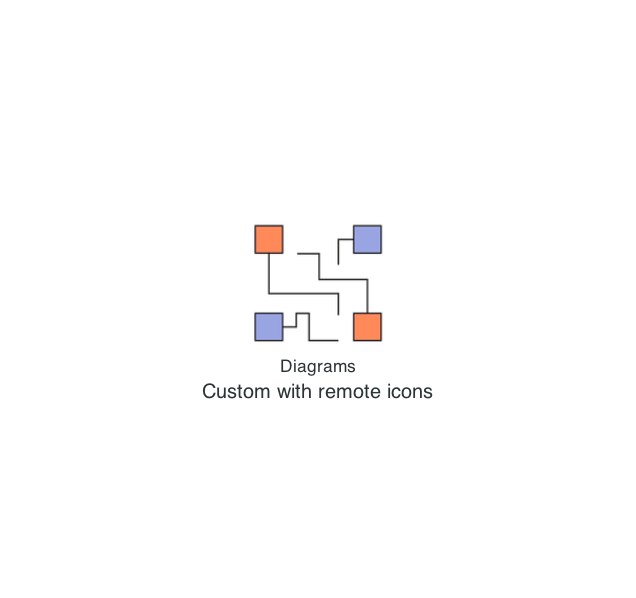
This allows for even more flexibility in designing architecture that suits your organization's needs.
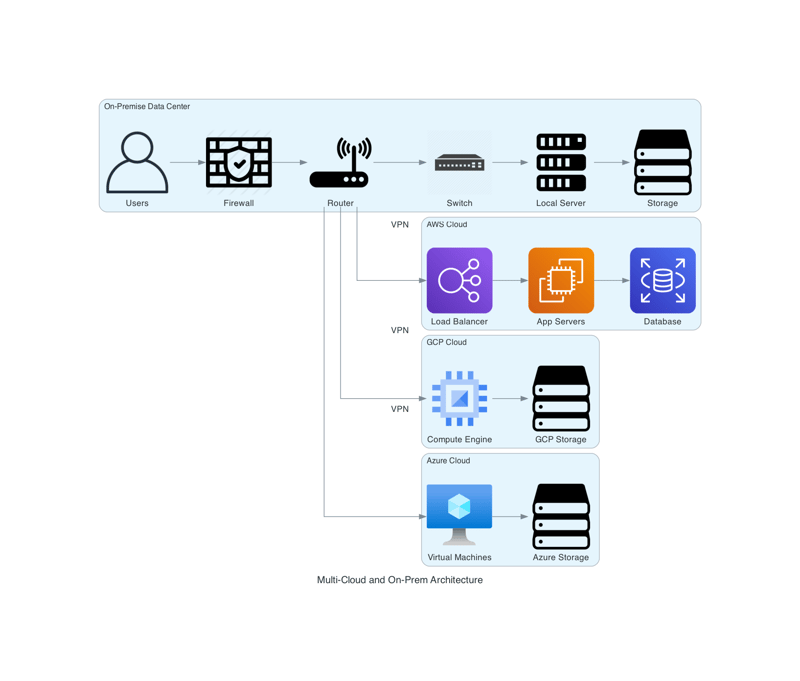
Combining Multi-Cloud and On-Premise Architectures
We can also use a combination of on-premise systems and cloud infrastructure, Diagrams makes it easy to combine these elements into a single view. You can visualize hybrid architectures seamlessly.
brew install graphviz
Challenges and Limitations
Although Diagrams is a powerful tool, there are some challenges:
- Performance: Generating very large diagrams with hundreds of components can be slow.
- Customization Limitations: While Diagrams offers a wide range of predefined components, adding highly customized elements might require extra work.
- Static Output: Diagrams generate static images. If you need interactive or real-time diagrams, you may need to integrate them with other tools.
Conclusion
The Diagrams Python library is a fantastic tool for automating the creation of infrastructure diagrams. By integrating it into your workflows, you can generate architecture diagrams dynamically as your infrastructure changes. Whether you’re documenting your cloud infrastructure or illustrating complex microservice architectures, Diagrams offers a powerful, programmatic way to visualize your systems

GitHub Repository
You can find the complete source code for the examples in this blog on my GitHub:
- My Diagrams Code Repository
Reference
- Diagrams: https://diagrams.mingrammer.com/docs/getting-started/installation
Disclaimer:
This is a personal blog. The views and opinions expressed here are only those of the author and do not represent those of any organization or any individual with whom the author may be associated, professionally or personally.
The above is the detailed content of Code Your Diagrams: Automate Architecture with Python&#s Diagrams Library. For more information, please follow other related articles on the PHP Chinese website!

Hot AI Tools

Undresser.AI Undress
AI-powered app for creating realistic nude photos

AI Clothes Remover
Online AI tool for removing clothes from photos.

Undress AI Tool
Undress images for free

Clothoff.io
AI clothes remover

Video Face Swap
Swap faces in any video effortlessly with our completely free AI face swap tool!

Hot Article
Hot Tools

Notepad++7.3.1
Easy-to-use and free code editor

SublimeText3 Chinese version
Chinese version, very easy to use

Zend Studio 13.0.1
Powerful PHP integrated development environment

Dreamweaver CS6
Visual web development tools

SublimeText3 Mac version
God-level code editing software (SublimeText3)
Hot Topics


 How to solve the permissions problem encountered when viewing Python version in Linux terminal?
Apr 01, 2025 pm 05:09 PM
How to solve the permissions problem encountered when viewing Python version in Linux terminal?
Apr 01, 2025 pm 05:09 PM
Solution to permission issues when viewing Python version in Linux terminal When you try to view Python version in Linux terminal, enter python...
 How to avoid being detected by the browser when using Fiddler Everywhere for man-in-the-middle reading?
Apr 02, 2025 am 07:15 AM
How to avoid being detected by the browser when using Fiddler Everywhere for man-in-the-middle reading?
Apr 02, 2025 am 07:15 AM
How to avoid being detected when using FiddlerEverywhere for man-in-the-middle readings When you use FiddlerEverywhere...
 How to efficiently copy the entire column of one DataFrame into another DataFrame with different structures in Python?
Apr 01, 2025 pm 11:15 PM
How to efficiently copy the entire column of one DataFrame into another DataFrame with different structures in Python?
Apr 01, 2025 pm 11:15 PM
When using Python's pandas library, how to copy whole columns between two DataFrames with different structures is a common problem. Suppose we have two Dats...
 How to teach computer novice programming basics in project and problem-driven methods within 10 hours?
Apr 02, 2025 am 07:18 AM
How to teach computer novice programming basics in project and problem-driven methods within 10 hours?
Apr 02, 2025 am 07:18 AM
How to teach computer novice programming basics within 10 hours? If you only have 10 hours to teach computer novice some programming knowledge, what would you choose to teach...
 How does Uvicorn continuously listen for HTTP requests without serving_forever()?
Apr 01, 2025 pm 10:51 PM
How does Uvicorn continuously listen for HTTP requests without serving_forever()?
Apr 01, 2025 pm 10:51 PM
How does Uvicorn continuously listen for HTTP requests? Uvicorn is a lightweight web server based on ASGI. One of its core functions is to listen for HTTP requests and proceed...
 How to solve permission issues when using python --version command in Linux terminal?
Apr 02, 2025 am 06:36 AM
How to solve permission issues when using python --version command in Linux terminal?
Apr 02, 2025 am 06:36 AM
Using python in Linux terminal...
 How to handle comma-separated list query parameters in FastAPI?
Apr 02, 2025 am 06:51 AM
How to handle comma-separated list query parameters in FastAPI?
Apr 02, 2025 am 06:51 AM
Fastapi ...
 How to get news data bypassing Investing.com's anti-crawler mechanism?
Apr 02, 2025 am 07:03 AM
How to get news data bypassing Investing.com's anti-crawler mechanism?
Apr 02, 2025 am 07:03 AM
Understanding the anti-crawling strategy of Investing.com Many people often try to crawl news data from Investing.com (https://cn.investing.com/news/latest-news)...
