

Visualizing Options Flow with Python: A Step-by-Step Guide

In the ever-evolving world of finance, visualizing data can offer unprecedented insights into market trends. In this article, we’ll explore how to leverage Python for a specific financial analysis task: visualizing options flow for a given stock using historical data from Yahoo Finance. We’ll be using a code snippet that fetches options data, processes it, and generates a scatter plot to illustrate the flow of call and put options. Let’s dive into the details.
Getting Started
Our goal is to analyze the options data for a particular stock and visualize it in a scatter plot. For this example, we’ll use the stock ticker LLY (Eli Lilly and Company). The code snippet accomplishes the following:
- Retrieves the latest options data for the specified stock.
- Filters and cleans the data.
- Creates a scatter plot to represent call and put options over time.
Step-by-Step Breakdown
1. Importing Libraries
First, we need to import the necessary libraries:
import yfinance as yf
import os
from datetime import datetime, timedelta
import matplotlib.pyplot as plt
import pandas as pd
- yfinance is used to fetch historical stock data.
- os handles directory and file operations.
- datetime and timedelta are for managing dates.
- matplotlib.pyplot is for creating visualizations.
- pandas is for data manipulation and analysis.
2. Setting Up Directories and Files
We set up the output directory and file where we will save our data:
output_directory = 'output'
os.makedirs(output_directory, exist_ok=True)
output_file = os.path.join(output_directory, 'output.data')
Here, we ensure that the output directory exists and specify the path for the data file.
3. Fetching and Processing Options Data
To get options data for the ticker LLY, we use yfinance:
ticker = 'LLY'
days = 21
populate_data = 'Y'  # Set 'N' to use existing file, 'Y' to create new file
If populate_data is set to 'Y', the code fetches new options data. If 'N', it will use the existing data file.
Here’s how the data fetching and processing is done:
if populate_data == 'Y':
    stock = yf.Ticker(ticker)
    options_dates = stock.options

    today = datetime.now()
    fourteen_days_later = today + timedelta(days)

    with open(output_file, 'w') as file:
        for date in options_dates:
            date_dt = datetime.strptime(date, '%Y-%m-%d')
            if today <= date_dt <= fourteen_days_later:
                calls = stock.option_chain(date).calls
                puts = stock.option_chain(date).puts

                for _, row in calls.iterrows():
                    if not filter_volume(row['volume']):
                        file.write(f"Call,{date},{row['strike']},{row['volume']}\n")

                for _, row in puts.iterrows():
                    if not filter_volume(row['volume']):
                        file.write(f"Put,{date},{row['strike']},{row['volume']}\n")

    print(f"Data has been written to {output_file}")
This code fetches call and put options data, filters out rows with unwanted volume data, and writes it to a file.
4. Cleaning and Preparing Data for Visualization
Next, we read the data and clean it:
data = pd.read_csv(output_file, names=['Type', 'Last_Trade_Date', 'Strike', 'Volume'])
data.dropna(inplace=True)
data['Last_Trade_Date'] = pd.to_datetime(data['Last_Trade_Date'])
data = data[data['Volume'].notna()]
We ensure that our dataset is free of NaN values and that the Last_Trade_Date is in the correct datetime format.
5. Creating the Scatter Plot
We’re ready to create our scatter plot:
extra_days_before = 5
extra_days_after = 5
min_date = data['Last_Trade_Date'].min() - timedelta(days=extra_days_before)
max_date = data['Last_Trade_Date'].max() + timedelta(days=extra_days_after)
plt.figure(figsize=(12, 8))
calls_data = data[data['Type'] == 'Call']
plt.scatter(calls_data['Last_Trade_Date'], calls_data['Strike'],
s=calls_data['Volume'], c='green', alpha=0.6, label='Call')
puts_data = data[data['Type'] == 'Put']
plt.scatter(puts_data['Last_Trade_Date'], puts_data['Strike'],
s=puts_data['Volume'], c='red', alpha=0.6, label='Put')
plt.xlabel('\nLast Trade Date')
plt.ylabel('Strike Price\n')
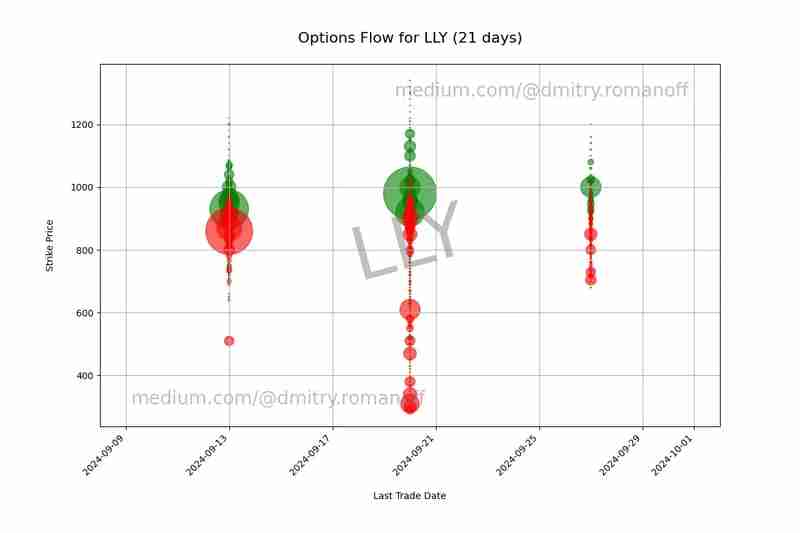
plt.title(f'Options Flow for {ticker} ({days} days)\n', fontsize=16)
plt.xticks(rotation=45, ha='right')
plt.gca().xaxis.set_major_formatter(plt.matplotlib.dates.DateFormatter('%Y-%m-%d'))
plt.xlim(min_date, max_date)
plt.subplots_adjust(bottom=0.2)
plt.grid(True)
plt.text(0.5, 0.5, f'{ticker}', color='gray', fontsize=80, alpha=0.5,
ha='center', va='center', rotation=15, transform=plt.gca().transAxes)
plt.text(0.95, 0.95, 'medium.com/@dmitry.romanoff', color='gray', fontsize=20, alpha=0.5,
ha='right', va='top', transform=plt.gca().transAxes)
plt.text(0.05, 0.05, 'medium.com/@dmitry.romanoff', color='gray', fontsize=20, alpha=0.5,
ha='left', va='bottom', transform=plt.gca().transAxes)
plot_file = os.path.join(output_directory, 'options_scatter_plot.png')
plt.savefig(plot_file)
print(f"Scatter plot has been saved to {plot_file}")
This segment creates a scatter plot of call and put options, with strike prices on the y-axis and trade dates on the x-axis. The size of the points represents the volume of trades, with green indicating calls and red indicating puts. We also add watermarks for branding purposes and save the plot to a file.
Conclusion
Visualizing options data helps traders and analysts understand market sentiment and trading activity. This guide demonstrated how to fetch, process, and visualize options data using Python. By following these steps, you can adapt this code for any stock and analyze its options flow, providing valuable insights into market trends.
Feel free to modify the code to fit your specific needs and explore different ways to visualize financial data.
The above is the detailed content of Visualizing Options Flow with Python: A Step-by-Step Guide. For more information, please follow other related articles on the PHP Chinese website!

Hot AI Tools

Undresser.AI Undress
AI-powered app for creating realistic nude photos

AI Clothes Remover
Online AI tool for removing clothes from photos.

Undress AI Tool
Undress images for free

Clothoff.io
AI clothes remover

Video Face Swap
Swap faces in any video effortlessly with our completely free AI face swap tool!

Hot Article
Hot Tools

Notepad++7.3.1
Easy-to-use and free code editor

SublimeText3 Chinese version
Chinese version, very easy to use

Zend Studio 13.0.1
Powerful PHP integrated development environment

Dreamweaver CS6
Visual web development tools

SublimeText3 Mac version
God-level code editing software (SublimeText3)
Hot Topics


 How to solve the permissions problem encountered when viewing Python version in Linux terminal?
Apr 01, 2025 pm 05:09 PM
How to solve the permissions problem encountered when viewing Python version in Linux terminal?
Apr 01, 2025 pm 05:09 PM
Solution to permission issues when viewing Python version in Linux terminal When you try to view Python version in Linux terminal, enter python...
 How to avoid being detected by the browser when using Fiddler Everywhere for man-in-the-middle reading?
Apr 02, 2025 am 07:15 AM
How to avoid being detected by the browser when using Fiddler Everywhere for man-in-the-middle reading?
Apr 02, 2025 am 07:15 AM
How to avoid being detected when using FiddlerEverywhere for man-in-the-middle readings When you use FiddlerEverywhere...
 How to efficiently copy the entire column of one DataFrame into another DataFrame with different structures in Python?
Apr 01, 2025 pm 11:15 PM
How to efficiently copy the entire column of one DataFrame into another DataFrame with different structures in Python?
Apr 01, 2025 pm 11:15 PM
When using Python's pandas library, how to copy whole columns between two DataFrames with different structures is a common problem. Suppose we have two Dats...
 How to teach computer novice programming basics in project and problem-driven methods within 10 hours?
Apr 02, 2025 am 07:18 AM
How to teach computer novice programming basics in project and problem-driven methods within 10 hours?
Apr 02, 2025 am 07:18 AM
How to teach computer novice programming basics within 10 hours? If you only have 10 hours to teach computer novice some programming knowledge, what would you choose to teach...
 How does Uvicorn continuously listen for HTTP requests without serving_forever()?
Apr 01, 2025 pm 10:51 PM
How does Uvicorn continuously listen for HTTP requests without serving_forever()?
Apr 01, 2025 pm 10:51 PM
How does Uvicorn continuously listen for HTTP requests? Uvicorn is a lightweight web server based on ASGI. One of its core functions is to listen for HTTP requests and proceed...
 How to solve permission issues when using python --version command in Linux terminal?
Apr 02, 2025 am 06:36 AM
How to solve permission issues when using python --version command in Linux terminal?
Apr 02, 2025 am 06:36 AM
Using python in Linux terminal...
 How to handle comma-separated list query parameters in FastAPI?
Apr 02, 2025 am 06:51 AM
How to handle comma-separated list query parameters in FastAPI?
Apr 02, 2025 am 06:51 AM
Fastapi ...
 How to get news data bypassing Investing.com's anti-crawler mechanism?
Apr 02, 2025 am 07:03 AM
How to get news data bypassing Investing.com's anti-crawler mechanism?
Apr 02, 2025 am 07:03 AM
Understanding the anti-crawling strategy of Investing.com Many people often try to crawl news data from Investing.com (https://cn.investing.com/news/latest-news)...
