A simple analysis of node.js debugging methods
This article mainly introduces a simple analysis of the debugging method of node.js. It has certain reference value. Now I share it with you. Friends in need can refer to it.
Debugging ability is programming One of the basic qualities is that quickly locating bugs can allow developers to get off work on time and avoid the pain of overtime. As we all know, JavaScript debugging is very convenient. As long as you open the browser and press F12, console.log or break points, you can always easily locate the error. Even many errors are immediately clear by looking at the error messages reported on the console. So how to debug node.js?
Use chrome plug-in NIM
Refer to the debug method on the official website. First install the chrome plug-in NIM (requires scientific Internet access) and then execute the file that needs to be debugged. For example, if there is a test.js file, enter it in the terminal. node --inspect-brk test.js Then chrome will automatically create a new page for you to debug. Below are the graphic steps
(Reference article: High-efficiency PHP debugging error prompt tool: the latest version of PHPstorm Detailed explanation of xdebug configuration and use (picture))
Write something just like that
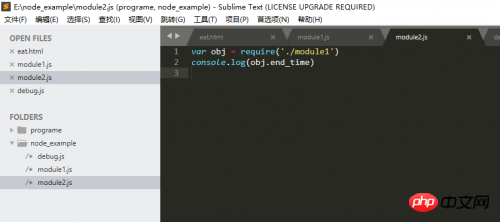
Install in the chrome app store NIM (if you cannot access it, you can search Google Access Assistant for scientific Internet access)
After the installation is completed, run the node.js file directly
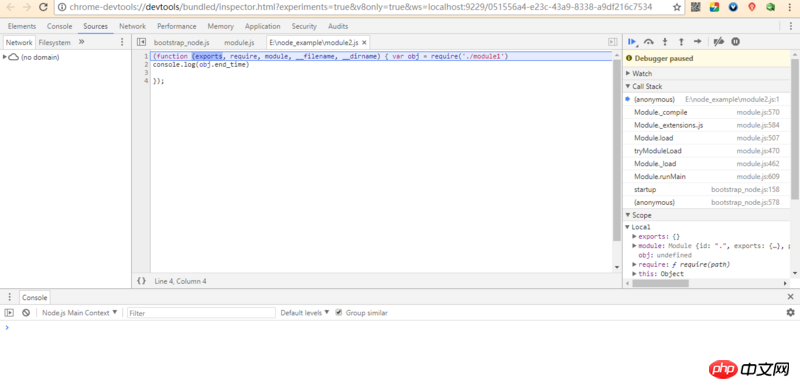
Browser A page will be automatically opened for debugging. The breakpoint debugging method is no longer described
And here you can see why each file in node.js is a separate module, and the code of each file is wrapped in in a function. You can also observe the function call stack to study node.js more deeply
 vscode debugging
vscode is an editor from Microsoft that comes with its own debugging function. If you have not used it, download and install it. If you have used it, open vscode directly
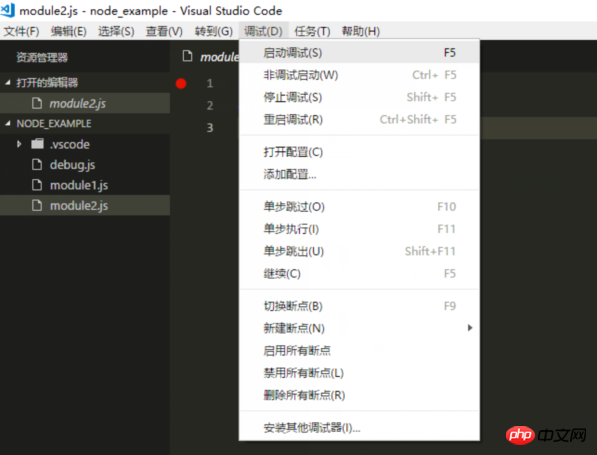
Click the icon in the red circle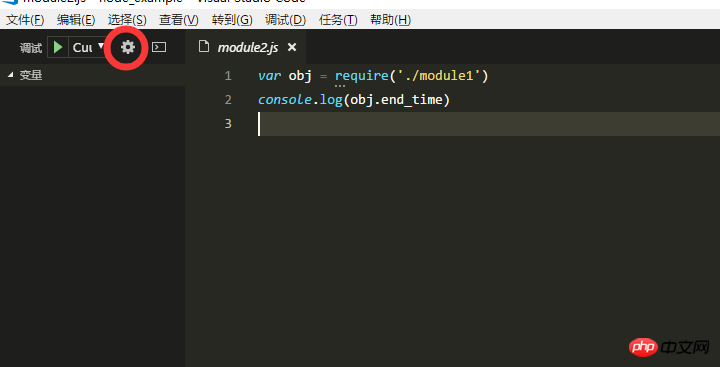
will open a json The configuration file appends a line of configuration to the object in configurations
"configurations": [
        {
            // here is somecode
            "cwd": "${cwd}"
        }
]ctrl s save
You can directly break the point on the left side of the current line of code, and then click the triangular green button in the upper left corner of the editor to start debugging . And you can step into step out like chrome for breakpoint debugging
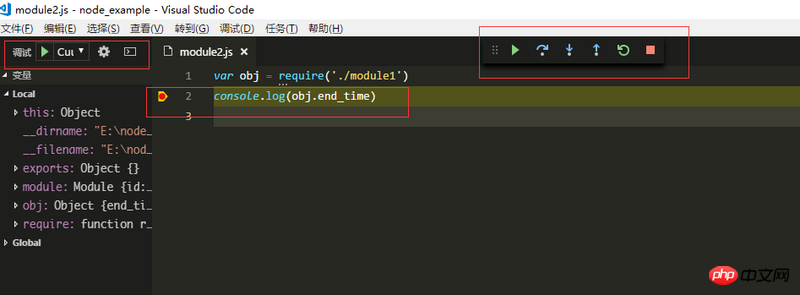
That’s it. There are many ways to debug, such as debugging directly in the code. Follow up Time will continue to be updated
The above is the entire content of this article. I hope it will be helpful to everyone's study. For more related content, please pay attention to the PHP Chinese website!
Related recommendations:
The above is the detailed content of A simple analysis of node.js debugging methods. For more information, please follow other related articles on the PHP Chinese website!

Hot AI Tools

Undresser.AI Undress
AI-powered app for creating realistic nude photos

AI Clothes Remover
Online AI tool for removing clothes from photos.

Undress AI Tool
Undress images for free

Clothoff.io
AI clothes remover

Video Face Swap
Swap faces in any video effortlessly with our completely free AI face swap tool!

Hot Article

Hot Tools

Notepad++7.3.1
Easy-to-use and free code editor

SublimeText3 Chinese version
Chinese version, very easy to use

Zend Studio 13.0.1
Powerful PHP integrated development environment

Dreamweaver CS6
Visual web development tools

SublimeText3 Mac version
God-level code editing software (SublimeText3)

Hot Topics
 Detailed graphic explanation of the memory and GC of the Node V8 engine
Mar 29, 2023 pm 06:02 PM
This article will give you an in-depth understanding of the memory and garbage collector (GC) of the NodeJS V8 engine. I hope it will be helpful to you!
 An article about memory control in Node
Apr 26, 2023 pm 05:37 PM
The Node service built based on non-blocking and event-driven has the advantage of low memory consumption and is very suitable for handling massive network requests. Under the premise of massive requests, issues related to "memory control" need to be considered. 1. V8’s garbage collection mechanism and memory limitations Js is controlled by the garbage collection machine
 Let's talk about how to choose the best Node.js Docker image?
Dec 13, 2022 pm 08:00 PM
Choosing a Docker image for Node may seem like a trivial matter, but the size and potential vulnerabilities of the image can have a significant impact on your CI/CD process and security. So how do we choose the best Node.js Docker image?
 Node.js 19 is officially released, let's talk about its 6 major features!
Nov 16, 2022 pm 08:34 PM
Node 19 has been officially released. This article will give you a detailed explanation of the 6 major features of Node.js 19. I hope it will be helpful to you!
 Let's talk in depth about the File module in Node
Apr 24, 2023 pm 05:49 PM
The file module is an encapsulation of underlying file operations, such as file reading/writing/opening/closing/delete adding, etc. The biggest feature of the file module is that all methods provide two versions of **synchronous** and **asynchronous**, with Methods with the sync suffix are all synchronization methods, and those without are all heterogeneous methods.
 Let's talk about the GC (garbage collection) mechanism in Node.js
Nov 29, 2022 pm 08:44 PM
How does Node.js do GC (garbage collection)? The following article will take you through it.
 Let's talk about the event loop in Node
Apr 11, 2023 pm 07:08 PM
The event loop is a fundamental part of Node.js and enables asynchronous programming by ensuring that the main thread is not blocked. Understanding the event loop is crucial to building efficient applications. The following article will give you an in-depth understanding of the event loop in Node. I hope it will be helpful to you!
 Let's talk about how to use pkg to package Node.js projects into executable files.
Dec 02, 2022 pm 09:06 PM
How to package nodejs executable file with pkg? The following article will introduce to you how to use pkg to package a Node project into an executable file. I hope it will be helpful to you!


