

JavaScript implements drawing graphics using Canvas

This article mainly introduces the basic tutorial of using JavaScript to draw graphics using Canvas. It has certain reference value and interested friends can refer to it.
Since HTML5 has become very popular in the past two years, I did some research. Recently, I had an idea to use HTML-related functions, so I also need to learn it carefully.
After taking a good look at the functions of Canvas, I feel that HTML5 is becoming more and more functional in client-side interaction. Today I took a look at Canvas drawing. Here are a few examples. Note them down for future use.
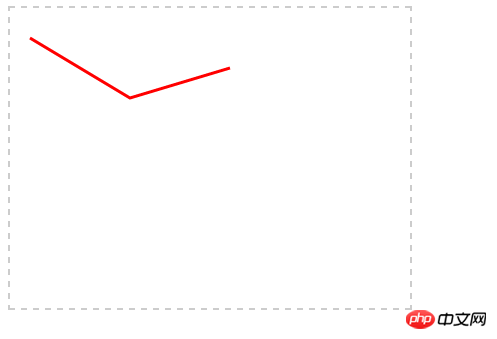
1. Use Canvas to draw a straight line:
<!doctype html>
<html>
<head>
<meta charset="UTF-8">
</head>
<style type="text/css">
canvas{border:dashed 2px #CCC}
</style>
<script type="text/javascript">
function $$(id){
return document.getElementById(id);
}
function pageLoad(){
var can = $$('can');
var cans = can.getContext('2d');
cans.moveTo(20,30);//第一个起点
cans.lineTo(120,90);//第二个点
cans.lineTo(220,60);//第三个点(以第二个点为起点)
cans.lineWidth=3;
cans.strokeStyle = 'red';
cans.stroke();
}
</script>
<body onload="pageLoad();">
<canvas id="can" width="400px" height="300px">4</canvas>
</body>
</html>Used here The two API methods, moveTo and lineTo are the starting point and end point coordinates of the line segment respectively, the variables are (X coordinate, Y coordinate), strokeStyle and stroke respectively path drawing style and drawing path.
2. Draw gradient lines
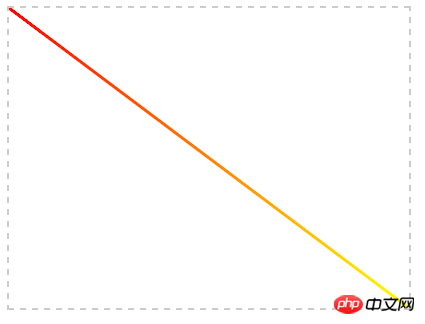
Gradient lines have a gradient effect in color. Of course, the gradient style can follow the direction of the path. You can also not follow the direction of the path:
<!doctype html>
<html>
<head>
<meta charset="UTF-8">
</head>
<style type="text/css">
canvas{border:dashed 2px #CCC}
</style>
<script type="text/javascript">
function $$(id){
return document.getElementById(id);
}
function pageLoad(){
var can = $$('can');
var cans = can.getContext('2d');
cans.moveTo(0,0);
cans.lineTo(400,300);
var gnt1 = cans.createLinearGradient(0,0,400,300);//线性渐变的起止坐标
gnt1.addColorStop(0,'red');//创建渐变的开始颜色,0表示偏移量,个人理解为直线上的相对位置,最大为1,一个渐变中可以写任意个渐变颜色
gnt1.addColorStop(1,'yellow');
cans.lineWidth=3;
cans.strokeStyle = gnt1;
cans.stroke();
}
</script>
<body onload="pageLoad();">
<canvas id="can" width="400px" height="300px">4</canvas>
</body>
</html>3. Draw a rectangle or square:
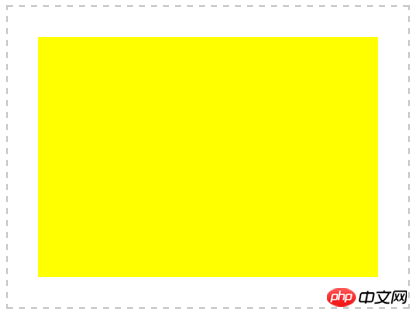
If you use HTML4, this kind of rectangular frame can only be generated using background code. Now the Canvas function provided by HTML5 can be easily drawn, so the superiority of HTML5 is quite high.
<!doctype html>
<html>
<head>
<meta charset="UTF-8">
</head>
<style type="text/css">
canvas{border:dashed 2px #CCC}
</style>
<script type="text/javascript">
function $$(id){
return document.getElementById(id);
}
function pageLoad(){
var can = $$('can');
var cans = can.getContext('2d');
cans.fillStyle = 'yellow';
cans.fillRect(30,30,340,240);
}
</script>
<body onload="pageLoad();">
<canvas id="can" width="400px" height="300px">4</canvas>
</body>
</html>A method is used here - fillRect(). From the literal meaning, you can also know that this is to fill a rectangle. The parameters here are worth explaining fillRect(X , Y, Width, Height), this is different from the coordinates in mathematics. For details, please see
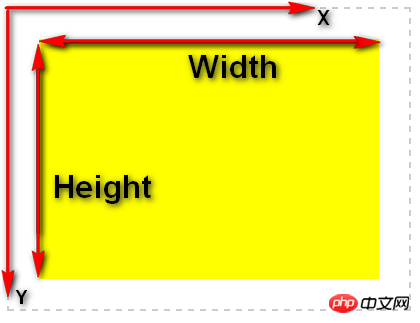
where X and Y are relative to the starting point of the upper left corner of the Canvas. Yes, remember! !
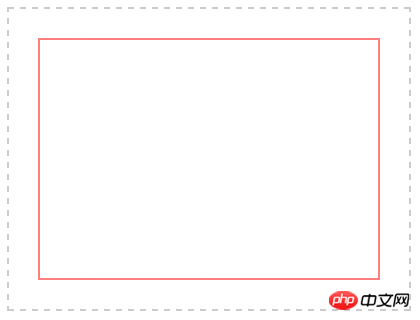
4. Draw a simple rectangular box
The above example talks about drawing a rectangular block and filling it with color. This example simply draws a rectangle. No filling effect is achieved.
<!doctype html>
<html>
<head>
<meta charset="UTF-8">
</head>
<style type="text/css">
canvas{border:dashed 2px #CCC}
</style>
<script type="text/javascript">
function $$(id){
return document.getElementById(id);
}
function pageLoad(){
var can = $$('can');
var cans = can.getContext('2d');
cans.strokeStyle = 'red';
cans.strokeRect(30,30,340,240);
}
</script>
<body onload="pageLoad();">
<canvas id="can" width="400px" height="300px">4</canvas>
</body>
</html>This is very simple, just like the above example, just replace fill with stroke. For details, see the above example. .
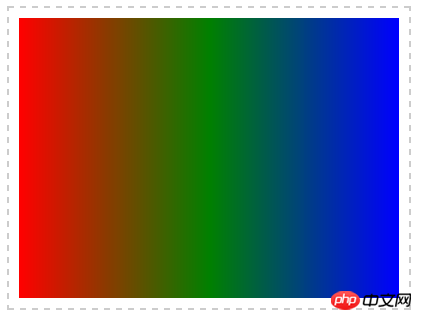
5. Draw a rectangle with linear gradient
Gradient is a pretty good effect of filling. Combining Example 2 and Example 3, we can create a gradient Rectangle
<!doctype html>
<html>
<head>
<meta charset="UTF-8">
</head>
<style type="text/css">
canvas{border:dashed 2px #CCC}
</style>
<script type="text/javascript">
function $$(id){
return document.getElementById(id);
}
function pageLoad(){
var can = $$('can');
var cans = can.getContext('2d');
var gnt1 = cans.createLinearGradient(10,0,390,0);
gnt1.addColorStop(0,'red');
gnt1.addColorStop(0.5,'green');
gnt1.addColorStop(1,'blue');
cans.fillStyle = gnt1;
cans.fillRect(10,10,380,280);
}
</script>
<body onload="pageLoad();">
<canvas id="can" width="400px" height="300px">4</canvas>
</body>
</html>I won’t explain it, just remember fillRect(X,Y,Width,Height).
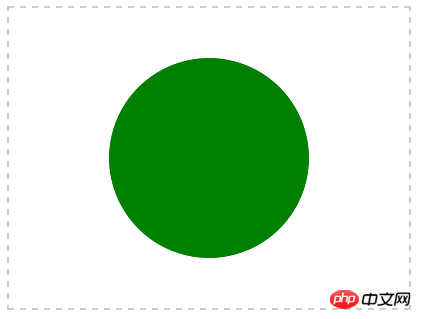
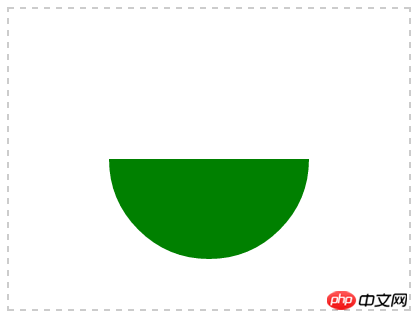
6. Fill a circle
Circles are widely used, and of course they also include ellipses.
<!doctype html>
<html>
<head>
<meta charset="UTF-8">
</head>
<style type="text/css">
canvas{border:dashed 2px #CCC}
</style>
<script type="text/javascript">
function $$(id){
return document.getElementById(id);
}
function pageLoad(){
var can = $$('can');
var cans = can.getContext('2d');
cans.beginPath();
cans.arc(200,150,100,0,Math.PI*2,true);
cans.closePath();
cans.fillStyle = 'green';//本来这里最初使用的是red,截图一看,傻眼了,怕上街被爱国者打啊,其实你懂的~~
cans.fill();
}
</script>
<body onload="pageLoad();">
<canvas id="can" width="400px" height="300px">4</canvas>
</body>
</html>The usage of arc method here is arc(X,Y,Radius,startAngle,endAngle,anticlockwise), It means (X coordinate of circle center, Y coordinate of circle center, radius, starting angle (radians), ending angle radians, whether to draw clockwise);
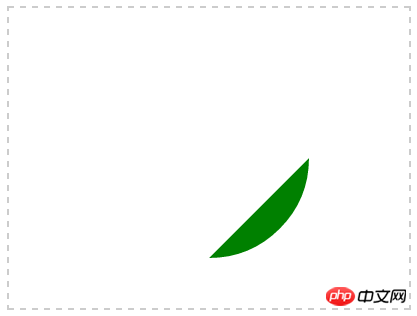
Comparison of parameters in arc:
a, cans.arc(200,150,100,0,Math.PI,true);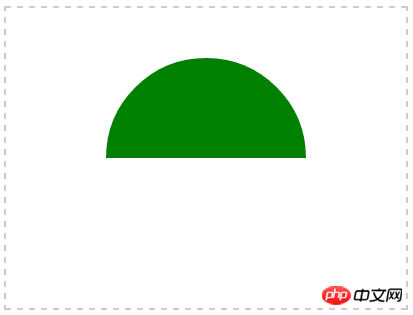
c、cans.arc(200,150,100,0,Math.PI/2,true);[/code]
c、cans.arc(200,150,100,0,Math.PI/2,true);
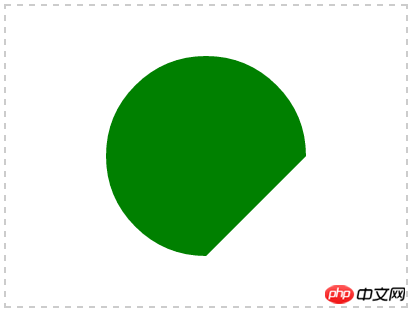
d , cans.arc(200,150,100,0,Math.PI/2,false);
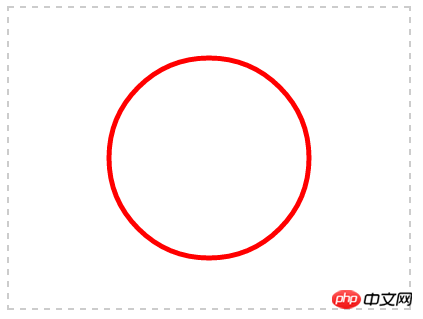
##7, circular block
<!doctype html>
<html>
<head>
<meta charset="UTF-8">
</head>
<style type="text/css">
canvas{border:dashed 2px #CCC}
</style>
<script type="text/javascript">
function $$(id){
return document.getElementById(id);
}
function pageLoad(){
var can = $$('can');
var cans = can.getContext('2d');
cans.beginPath();
cans.arc(200,150,100,0,Math.PI*2,false);
cans.closePath();
cans.lineWidth = 5;
cans.strokeStyle = 'red';
cans.stroke();
}
</script>
<body onload="pageLoad();">
<canvas id="can" width="400px" height="300px">4</canvas>
</body>
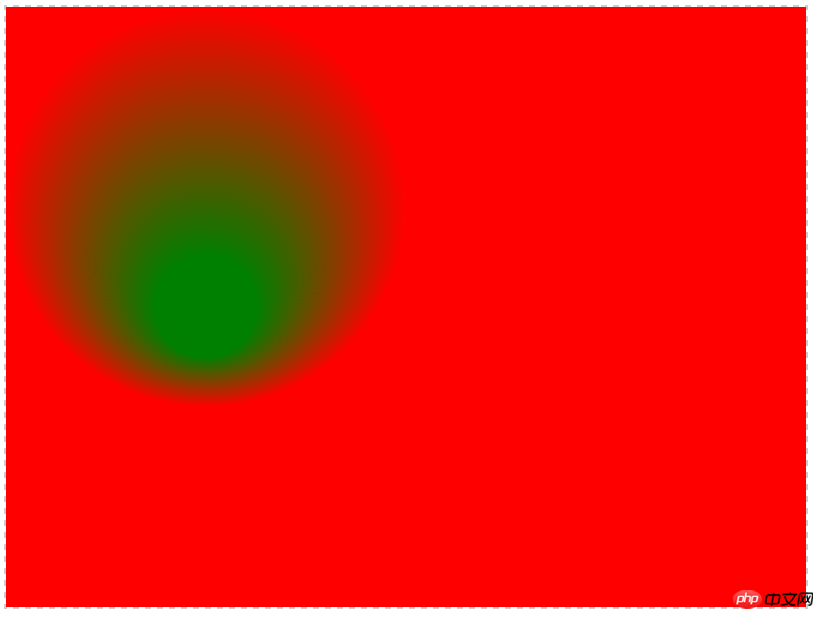
</html>8, circular gradient
<!doctype html>
<html>
<head>
<meta charset="UTF-8">
</head>
<style type="text/css">
canvas{border:dashed 2px #CCC}
</style>
<script type="text/javascript">
function $$(id){
return document.getElementById(id);
}
function pageLoad(){
var can = $$('can');
var cans = can.getContext('2d');
var gnt = cans.createRadialGradient(200,300,50,200,200,200);
gnt.addColorStop(1,'red');
gnt.addColorStop(0,'green');
cans.fillStyle = gnt;
cans.fillRect(0,0,800,600);
}
</script>
<body onload="pageLoad();">
<canvas id="can" width="800px" height="600px">4</canvas>
</body>
</html>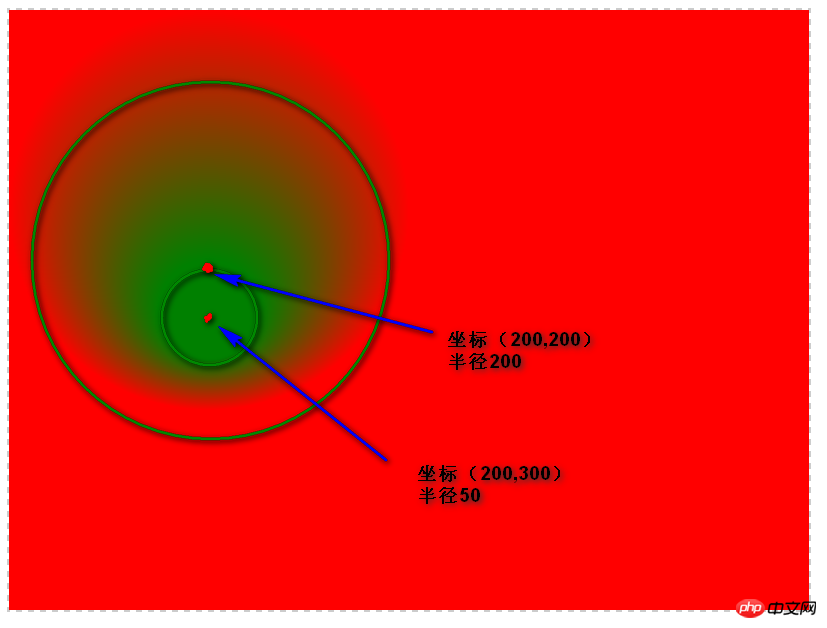
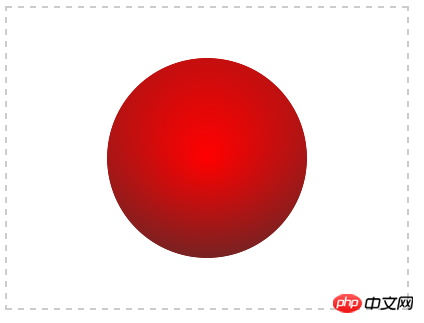
var gnt = cans.createRadialGradient(200,150,0,200,50,250);
gnt.addColorStop(0,'red');
gnt.addColorStop(1,'#333');
以上就是本文的全部内容,希望对大家的学习有所帮助,更多相关内容请关注PHP中文网!
相关推荐:
JavaScript和html5 canvas如何绘制一个小人的代码
The above is the detailed content of JavaScript implements drawing graphics using Canvas. For more information, please follow other related articles on the PHP Chinese website!

Hot AI Tools

Undresser.AI Undress
AI-powered app for creating realistic nude photos

AI Clothes Remover
Online AI tool for removing clothes from photos.

Undress AI Tool
Undress images for free

Clothoff.io
AI clothes remover

Video Face Swap
Swap faces in any video effortlessly with our completely free AI face swap tool!

Hot Article
Hot Tools

Notepad++7.3.1
Easy-to-use and free code editor

SublimeText3 Chinese version
Chinese version, very easy to use

Zend Studio 13.0.1
Powerful PHP integrated development environment

Dreamweaver CS6
Visual web development tools

SublimeText3 Mac version
God-level code editing software (SublimeText3)
Hot Topics


 Recommended: Excellent JS open source face detection and recognition project
Apr 03, 2024 am 11:55 AM
Recommended: Excellent JS open source face detection and recognition project
Apr 03, 2024 am 11:55 AM
Face detection and recognition technology is already a relatively mature and widely used technology. Currently, the most widely used Internet application language is JS. Implementing face detection and recognition on the Web front-end has advantages and disadvantages compared to back-end face recognition. Advantages include reducing network interaction and real-time recognition, which greatly shortens user waiting time and improves user experience; disadvantages include: being limited by model size, the accuracy is also limited. How to use js to implement face detection on the web? In order to implement face recognition on the Web, you need to be familiar with related programming languages and technologies, such as JavaScript, HTML, CSS, WebRTC, etc. At the same time, you also need to master relevant computer vision and artificial intelligence technologies. It is worth noting that due to the design of the Web side
 How to create a stock candlestick chart using PHP and JS
Dec 17, 2023 am 08:08 AM
How to create a stock candlestick chart using PHP and JS
Dec 17, 2023 am 08:08 AM
How to use PHP and JS to create a stock candle chart. A stock candle chart is a common technical analysis graphic in the stock market. It helps investors understand stocks more intuitively by drawing data such as the opening price, closing price, highest price and lowest price of the stock. price fluctuations. This article will teach you how to create stock candle charts using PHP and JS, with specific code examples. 1. Preparation Before starting, we need to prepare the following environment: 1. A server running PHP 2. A browser that supports HTML5 and Canvas 3
 Essential tools for stock analysis: Learn the steps to draw candle charts with PHP and JS
Dec 17, 2023 pm 06:55 PM
Essential tools for stock analysis: Learn the steps to draw candle charts with PHP and JS
Dec 17, 2023 pm 06:55 PM
Essential tools for stock analysis: Learn the steps to draw candle charts in PHP and JS. Specific code examples are required. With the rapid development of the Internet and technology, stock trading has become one of the important ways for many investors. Stock analysis is an important part of investor decision-making, and candle charts are widely used in technical analysis. Learning how to draw candle charts using PHP and JS will provide investors with more intuitive information to help them make better decisions. A candlestick chart is a technical chart that displays stock prices in the form of candlesticks. It shows the stock price
 PHP and JS Development Tips: Master the Method of Drawing Stock Candle Charts
Dec 18, 2023 pm 03:39 PM
PHP and JS Development Tips: Master the Method of Drawing Stock Candle Charts
Dec 18, 2023 pm 03:39 PM
With the rapid development of Internet finance, stock investment has become the choice of more and more people. In stock trading, candle charts are a commonly used technical analysis method. It can show the changing trend of stock prices and help investors make more accurate decisions. This article will introduce the development skills of PHP and JS, lead readers to understand how to draw stock candle charts, and provide specific code examples. 1. Understanding Stock Candle Charts Before introducing how to draw stock candle charts, we first need to understand what a candle chart is. Candlestick charts were developed by the Japanese
 Learn the canvas framework and explain the commonly used canvas framework in detail
Jan 17, 2024 am 11:03 AM
Learn the canvas framework and explain the commonly used canvas framework in detail
Jan 17, 2024 am 11:03 AM
Explore the Canvas framework: To understand what are the commonly used Canvas frameworks, specific code examples are required. Introduction: Canvas is a drawing API provided in HTML5, through which we can achieve rich graphics and animation effects. In order to improve the efficiency and convenience of drawing, many developers have developed different Canvas frameworks. This article will introduce some commonly used Canvas frameworks and provide specific code examples to help readers gain a deeper understanding of how to use these frameworks. 1. EaselJS framework Ea
 The relationship between js and vue
Mar 11, 2024 pm 05:21 PM
The relationship between js and vue
Mar 11, 2024 pm 05:21 PM
The relationship between js and vue: 1. JS as the cornerstone of Web development; 2. The rise of Vue.js as a front-end framework; 3. The complementary relationship between JS and Vue; 4. The practical application of JS and Vue.
 Explore the powerful role and application of canvas in game development
Jan 17, 2024 am 11:00 AM
Explore the powerful role and application of canvas in game development
Jan 17, 2024 am 11:00 AM
Understand the power and application of canvas in game development Overview: With the rapid development of Internet technology, web games are becoming more and more popular among players. As an important part of web game development, canvas technology has gradually emerged in game development, showing its powerful power and application. This article will introduce the potential of canvas in game development and demonstrate its application through specific code examples. 1. Introduction to canvas technology Canvas is a new element in HTML5, which allows us to use
 How to operate PPT drawing
Mar 20, 2024 pm 07:36 PM
How to operate PPT drawing
Mar 20, 2024 pm 07:36 PM
Many people’s understanding of PPT is that it can only be used as slides. If the document is unclear, use PPT to present it. In fact, PPT can put pictures and videos into slides for better reference and more intuitive presentation. What you want to express. PPT can also be made into a mind map and put in it for everyone to better understand. It can be said that PPT is a summary of something that is difficult to express verbally. It has complete functions and many uses. Well, I believe you must not know that in addition to these complete functions and usages, PPT can also be used to draw pictures. So how to draw pictures in PPT? 1. First, we open PPT, click [Insert], click [Shape], and select a graphic or pattern you like. 2. After selecting the pattern, click [
