

JavaScript prevents memory leaks
1. What is a memory leak?
The running of the program requires memory. Whenever a program asks for it, the operating system or runtime must provide memory.
For a continuously running service process (daemon), memory that is no longer used must be released in a timely manner. Otherwise, the memory usage will become higher and higher, which will affect the system performance at best and cause the process to crash at worst.

Memory that is no longer used and is not released in time is called a memory leak.
Some languages (such as C language) must manually release memory, and the programmer is responsible for memory management.
char * buffer;
buffer = (char*) malloc(42);

// Do something with buffer

free(buffer);
Copy after login
The above is C language code. The malloc method is used to apply for memory. After use, you must use the free method to release the memory.
This is troublesome, so most languages provide automatic memory management to reduce the burden on programmers. This is called a "garbage collector".
2. Garbage collection mechanism
How does the garbage collection mechanism know which memory is no longer needed?
The most commonly used method is called "reference counting": the language engine has a "reference table" that saves the number of references to all resources (usually various values) in the memory. If the number of references to a value is 0, it means that the value is no longer used, so the memory can be released.
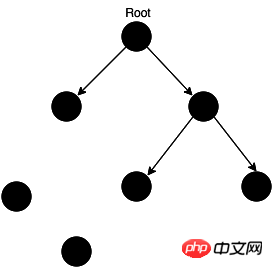
In the picture above, the two values in the lower left corner have no references, so they can be released.
If a value is no longer needed but the reference number is not 0, the garbage collection mechanism cannot release the memory, resulting in a memory leak.
const arr = [1, 2, 3, 4];
console.log('hello world');
Copy after login
In the above code, the array [1, 2, 3, 4] is a value and will occupy memory. The variable arr is the only reference to this value, so the number of references is 1. Although arr is not used in the following code, it will continue to occupy memory.
If you add a line of code to dereference arr to [1, 2, 3, 4], this memory can be released by the garbage collection mechanism.
const arr = [1, 2, 3, 4];
console.log('hello world');
arr = null;
Copy after login
In the above code, when arr is reset to null, the reference to [1, 2, 3, 4] is released, the number of references becomes 0, and the memory can be released.
Therefore, it does not mean that programmers will be relaxed with the garbage collection mechanism. You still need to pay attention to memory usage: those values that take up a lot of space, once they are no longer used, you have to check whether there are still references to them. If it is, you'll have to manually dereference it.
3. How to identify memory leaks
How can you observe a memory leak?
The rule of thumb is that if the memory usage becomes larger each time after five consecutive garbage collections, there is a memory leak. This requires real-time viewing of memory usage.
3.1 Browser
To check the memory usage of Chrome browser, follow the steps below.

Open the developer tools and select the Timeline panel
In the Capture field at the top, check Memory
Click the record button in the upper left corner.
Perform various operations on the page to simulate user usage.
After a period of time, click the stop button in the dialog box, and the memory usage during this period will be displayed on the panel.
If the memory usage is basically stable and close to level, it means there is no memory leak.
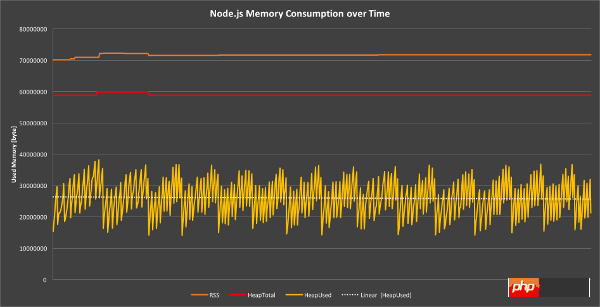
Otherwise, there is a memory leak.

3.2 Command line
The command line can use the process.memoryUsage method provided by Node.
console.log(process.memoryUsage());
// { rss: 27709440,
//  heapTotal: 5685248,
//  heapUsed: 3449392,
//  external: 8772 }
Copy after login
Process.memoryUsage returns an object containing the memory usage information of the Node process. This object contains four fields, the unit is bytes, the meaning is as follows.

rss (resident set size): All memory usage, including instruction area and stack.
heapTotal:"堆"占用的内存,包括用到的和没用到的。
heapUsed:用到的堆的部分。
external: V8 引擎内部的 C++ 对象占用的内存。
判断内存泄漏,以heapUsed字段为准。
四、WeakMap
前面说过,及时清除引用非常重要。但是,你不可能记得那么多,有时候一疏忽就忘了,所以才有那么多内存泄漏。
最好能有一种方法,在新建引用的时候就声明,哪些引用必须手动清除,哪些引用可以忽略不计,当其他引用消失以后,垃圾回收机制就可以释放内存。这样就能大大减轻程序员的负担,你只要清除主要引用就可以了。
ES6 考虑到了这一点,推出了两种新的数据结构:WeakSet 和 WeakMap。它们对于值的引用都是不计入垃圾回收机制的,所以名字里面才会有一个"Weak",表示这是弱引用。

下面以 WeakMap 为例,看看它是怎么解决内存泄漏的。
const wm = new WeakMap();

const element = document.getElementById('example');

wm.set(element, 'some information');
wm.get(element) // "some information"
Copy after login
上面代码中,先新建一个 Weakmap 实例。然后,将一个 DOM 节点作为键名存入该实例,并将一些附加信息作为键值,一起存放在 WeakMap 里面。这时,WeakMap 里面对element的引用就是弱引用,不会被计入垃圾回收机制。
也就是说,DOM 节点对象的引用计数是1,而不是2。这时,一旦消除对该节点的引用,它占用的内存就会被垃圾回收机制释放。Weakmap 保存的这个键值对,也会自动消失。
基本上,如果你要往对象上添加数据,又不想干扰垃圾回收机制,就可以使用 WeakMap。
五、WeakMap 示例
WeakMap 的例子很难演示,因为无法观察它里面的引用会自动消失。此时,其他引用都解除了,已经没有引用指向 WeakMap 的键名了,导致无法证实那个键名是不是存在。
我一直想不出办法,直到有一天贺师俊老师提示,如果引用所指向的值占用特别多的内存,就可以通过process.memoryUsage方法看出来。
根据这个思路,网友 vtxf 补充了下面的例子。
首先,打开 Node 命令行。
$ node --expose-gcCopy after login
上面代码中,--expose-gc参数表示允许手动执行垃圾回收机制。
然后,执行下面的代码。
// 手动执行一次垃圾回收,保证获取的内存使用状态准确
> global.gc();
undefined

// 查看内存占用的初始状态,heapUsed 为 4M 左右
> process.memoryUsage();
{ rss: 21106688,
  heapTotal: 7376896,
  heapUsed: 4153936,
  external: 9059 }

> let wm = new WeakMap();
undefined

> const b = new Object();
undefined

> global.gc();
undefined

// 此时,heapUsed 仍然为 4M 左右
> process.memoryUsage();
{ rss: 20537344,
  heapTotal: 9474048,
  heapUsed: 3967272,
  external: 8993 }

// 在 WeakMap 中添加一个键值对,
// 键名为对象 b,键值为一个 5*1024*1024 的数组
> wm.set(b, new Array(5*1024*1024));
WeakMap {}

// 手动执行一次垃圾回收
> global.gc();
undefined

// 此时,heapUsed 为 45M 左右
> process.memoryUsage();
{ rss: 62652416,
  heapTotal: 51437568,
  heapUsed: 45911664,
  external: 8951 }

// 解除对象 b 的引用
> b = null;
null

// 再次执行垃圾回收
> global.gc();
undefined

// 解除 b 的引用以后,heapUsed 变回 4M 左右
// 说明 WeakMap 中的那个长度为 5*1024*1024 的数组被销毁了
> process.memoryUsage();
{ rss: 20639744,
  heapTotal: 8425472,
  heapUsed: 3979792,
  external: 8956 }
Copy after login
上面代码中,只要外部的引用消失,WeakMap 内部的引用,就会自动被垃圾回收清除。由此可见,有了它的帮助,解决内存泄漏就会简单很多。
六、参考链接
Simple Guide to Finding a JavaScript Memory Leak in Node.js
Understanding Garbage Collection and hunting Memory Leaks in Node.js
Debugging Memory Leaks in Node.js Applications
The above is the detailed content of JavaScript prevents memory leaks. For more information, please follow other related articles on the PHP Chinese website!

Hot AI Tools

Undresser.AI Undress
AI-powered app for creating realistic nude photos

AI Clothes Remover
Online AI tool for removing clothes from photos.

Undress AI Tool
Undress images for free

Clothoff.io
AI clothes remover

Video Face Swap
Swap faces in any video effortlessly with our completely free AI face swap tool!

Hot Article
Hot Tools

Notepad++7.3.1
Easy-to-use and free code editor

SublimeText3 Chinese version
Chinese version, very easy to use

Zend Studio 13.0.1
Powerful PHP integrated development environment

Dreamweaver CS6
Visual web development tools

SublimeText3 Mac version
God-level code editing software (SublimeText3)
Hot Topics


 Go memory leak tracking: Go pprof practical guide
Apr 08, 2024 am 10:57 AM
Go memory leak tracking: Go pprof practical guide
Apr 08, 2024 am 10:57 AM
The pprof tool can be used to analyze the memory usage of Go applications and detect memory leaks. It provides memory profile generation, memory leak identification and real-time analysis capabilities. Generate a memory snapshot by using pprof.Parse and identify the data structures with the most memory allocations using the pprof-allocspace command. At the same time, pprof supports real-time analysis and provides endpoints to remotely access memory usage information.
 Solve the memory leak problem caused by closures
Feb 18, 2024 pm 03:20 PM
Solve the memory leak problem caused by closures
Feb 18, 2024 pm 03:20 PM
Title: Memory leaks caused by closures and solutions Introduction: Closures are a very common concept in JavaScript, which allow internal functions to access variables of external functions. However, closures can cause memory leaks if used incorrectly. This article will explore the memory leak problem caused by closures and provide solutions and specific code examples. 1. Memory leaks caused by closures The characteristic of closures is that internal functions can access variables of external functions, which means that variables referenced in closures will not be garbage collected. If used improperly,
 Simple JavaScript Tutorial: How to Get HTTP Status Code
Jan 05, 2024 pm 06:08 PM
Simple JavaScript Tutorial: How to Get HTTP Status Code
Jan 05, 2024 pm 06:08 PM
JavaScript tutorial: How to get HTTP status code, specific code examples are required. Preface: In web development, data interaction with the server is often involved. When communicating with the server, we often need to obtain the returned HTTP status code to determine whether the operation is successful, and perform corresponding processing based on different status codes. This article will teach you how to use JavaScript to obtain HTTP status codes and provide some practical code examples. Using XMLHttpRequest
 How to avoid memory leaks in Golang technical performance optimization?
Jun 04, 2024 pm 12:27 PM
How to avoid memory leaks in Golang technical performance optimization?
Jun 04, 2024 pm 12:27 PM
Memory leaks can cause Go program memory to continuously increase by: closing resources that are no longer in use, such as files, network connections, and database connections. Use weak references to prevent memory leaks and target objects for garbage collection when they are no longer strongly referenced. Using go coroutine, the coroutine stack memory will be automatically released when exiting to avoid memory leaks.
 How to detect memory leaks using Valgrind?
Jun 05, 2024 am 11:53 AM
How to detect memory leaks using Valgrind?
Jun 05, 2024 am 11:53 AM
Valgrind detects memory leaks and errors by simulating memory allocation and deallocation. To use it, follow these steps: Install Valgrind: Download and install the version for your operating system from the official website. Compile the program: Compile the program using Valgrind flags (such as gcc-g-omyprogrammyprogram.c-lstdc++). Analyze the program: Use the valgrind--leak-check=fullmyprogram command to analyze the compiled program. Check the output: Valgrind will generate a report after the program execution, showing memory leaks and error messages.
 Debugging techniques for memory leaks in C++
Jun 05, 2024 pm 10:19 PM
Debugging techniques for memory leaks in C++
Jun 05, 2024 pm 10:19 PM
A memory leak in C++ means that the program allocates memory but forgets to release it, causing the memory to not be reused. Debugging techniques include using debuggers (such as Valgrind, GDB), inserting assertions, and using memory leak detector libraries (such as Boost.LeakDetector, MemorySanitizer). It demonstrates the use of Valgrind to detect memory leaks through practical cases, and proposes best practices to avoid memory leaks, including: always releasing allocated memory, using smart pointers, using memory management libraries, and performing regular memory checks.
 How to effectively avoid memory leaks in closures?
Jan 13, 2024 pm 12:46 PM
How to effectively avoid memory leaks in closures?
Jan 13, 2024 pm 12:46 PM
How to prevent memory leaks in closures? Closure is one of the most powerful features in JavaScript, which enables nesting of functions and encapsulation of data. However, closures are also prone to memory leaks, especially when dealing with asynchronous and timers. This article explains how to prevent memory leaks in closures and provides specific code examples. Memory leaks usually occur when an object is no longer needed but the memory it occupies cannot be released for some reason. In a closure, when a function refers to external variables, and these variables
 How to get HTTP status code in JavaScript the easy way
Jan 05, 2024 pm 01:37 PM
How to get HTTP status code in JavaScript the easy way
Jan 05, 2024 pm 01:37 PM
Introduction to the method of obtaining HTTP status code in JavaScript: In front-end development, we often need to deal with the interaction with the back-end interface, and HTTP status code is a very important part of it. Understanding and obtaining HTTP status codes helps us better handle the data returned by the interface. This article will introduce how to use JavaScript to obtain HTTP status codes and provide specific code examples. 1. What is HTTP status code? HTTP status code means that when the browser initiates a request to the server, the service
