
 Backend Development
Python Tutorial
Which libraries in Python can be used for data visualization?
Backend Development
Python Tutorial
Which libraries in Python can be used for data visualization?
Which libraries in Python can be used for data visualization?


As a powerful programming language, Python has a rich data visualization library to help users display data more intuitively and better understand and analyze data. This article will introduce several commonly used Python data visualization libraries and provide specific code examples to help readers better master the use of these libraries.
1. Matplotlib
Matplotlib is one of the most commonly used data visualization libraries in Python. It can create various types of charts, including line charts, scatter charts, histograms, etc. The following is a simple line chart example:
import matplotlib.pyplot as plt

# 创建数据
x = [1, 2, 3, 4, 5]
y = [2, 3, 5, 7, 6]

# 绘制折线图
plt.plot(x, y)
plt.title('Simple Line Plot')
plt.xlabel('X')
plt.ylabel('Y')
plt.show()2. Seaborn
Seaborn is a data visualization library based on Matplotlib, providing a simpler interface and more beautiful style. The following is a simple box plot example:
import seaborn as sns
import matplotlib.pyplot as plt

# 创建数据
data = [0, 1, 2, 3, 4, 5]

# 绘制箱线图
sns.boxplot(data=data)
plt.title('Box Plot')
plt.show()3. Plotly
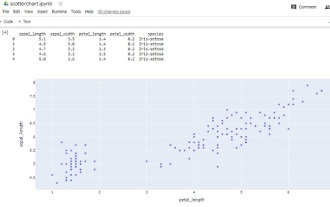
Plotly is an interactive data visualization library that can create line graphs, scatter plots, heat maps, etc. Various charts within. Here is a simple scatter plot example:
import plotly.express as px

# 创建数据
data = {'x': [1, 2, 3, 4, 5], 'y': [2, 3, 5, 7, 6]}

# 绘制散点图
fig = px.scatter(data, x='x', y='y')
fig.update_layout(title='Scatter Plot')
fig.show()4. Bokeh
Bokeh is a library for creating interactive charts that can be interacted with on the web and add toolbars. The following is a simple histogram example:
from bokeh.plotting import figure, show

# 创建数据
x = [1, 2, 3, 4, 5]
y = [2, 3, 5, 7, 6]

# 绘制柱状图
p = figure(x_axis_label='X', y_axis_label='Y')
p.vbar(x=x, top=y, width=0.5, color='blue')
show(p)
The above are several commonly used Python data visualization libraries and their code examples. Readers can choose the appropriate library to display data according to their own needs, so as to understand and analyze the data more intuitively.
The above is the detailed content of Which libraries in Python can be used for data visualization?. For more information, please follow other related articles on the PHP Chinese website!

Hot AI Tools

Undresser.AI Undress
AI-powered app for creating realistic nude photos

AI Clothes Remover
Online AI tool for removing clothes from photos.

Undress AI Tool
Undress images for free

Clothoff.io
AI clothes remover

Video Face Swap
Swap faces in any video effortlessly with our completely free AI face swap tool!

Hot Article
Hot Tools

Notepad++7.3.1
Easy-to-use and free code editor

SublimeText3 Chinese version
Chinese version, very easy to use

Zend Studio 13.0.1
Powerful PHP integrated development environment

Dreamweaver CS6
Visual web development tools

SublimeText3 Mac version
God-level code editing software (SublimeText3)
Hot Topics


 How to add text to heat map cell comments using seaborn in Python?
Aug 19, 2023 pm 04:09 PM
How to add text to heat map cell comments using seaborn in Python?
Aug 19, 2023 pm 04:09 PM
Heat maps are useful for identifying patterns and trends in your data, and can be further customized by adding annotations to cells, such as text labels or numerical values, which can provide additional information about the data. In this article, we will discuss how to add text to heat map cell comments using Seaborn in Python. We will explore the different methods and options available in Seaborn to customize text annotations, such as changing the font size, color, and formatting of the text. Heat Maps A heat map (or heat map) is a data visualization method that uses different colors on a two-dimensional plot to represent the intensity of a phenomenon. Colors may vary in hue or saturation to show the reader how phenomena cluster or vary over time and space. The main points of heat map
 Python visualization | Python visualization advanced essentials - plotly
May 03, 2023 pm 02:07 PM
Python visualization | Python visualization advanced essentials - plotly
May 03, 2023 pm 02:07 PM
1. Introduction Plotly is a very famous and powerful open source data visualization framework. It displays information by building interactive charts based on browser display in the form of web, and can create dozens of beautiful charts and maps. 2. Drawing grammar rules 2.1 Offline drawing method There are two ways to draw images in Plotly, online and offline. Because online drawing requires registering an account to obtain an APIkey, which is more troublesome, this article only introduces the offline drawing method. There are two methods for offline drawing: plotly.offline.plot() and plotly.offline.iplot(). The former generates an image file in html format in the current working directory in an offline way and opens it automatically;
 How to make a basic scatter plot using Python-Plotly?
Aug 31, 2023 pm 01:37 PM
How to make a basic scatter plot using Python-Plotly?
Aug 31, 2023 pm 01:37 PM
Sometimes the task is to analyze a data set and visualize the data using charts or plots. Plotly is a great open source graphics library that can be used with Python for making a variety of plots and charts quickly and easily. In this article, using two different examples, a Python library called Plotly is used with Python code to plot a scatter plot. In the first example, the Python installed in the computer system is used to run a Python program written to make a scatter plot. Another example, using Google Colab, shows how you can still use Python and Plotly and make scatter plots without Python installed on your computer. In these two
 Detailed explanation of seaborn, a data visualization library in Python
Jun 10, 2023 am 11:25 AM
Detailed explanation of seaborn, a data visualization library in Python
Jun 10, 2023 am 11:25 AM
Detailed explanation of the data visualization library seaborn in Python In the field of data science, data visualization is an extremely important skill. As a versatile language, Python has become the first choice of many data scientists. There are many visualization libraries in Python, one of the popular ones is seaborn. seaborn is a Python advanced data visualization library developed based on the matplotlib library. It provides a more beautiful and simple visual interface, suitable for complex data processing
 How to use the Python visualization plotly framework
May 09, 2023 pm 12:07 PM
How to use the Python visualization plotly framework
May 09, 2023 pm 12:07 PM
1. Introduction Plotly is a very famous and powerful open source data visualization framework. It displays information by building interactive charts based on browser display in the form of web, and can create dozens of beautiful charts and maps. 2. Drawing grammar rules 2.1 Offline drawing method There are two ways to draw images in Plotly, online and offline. Because online drawing requires registering an account to obtain an APIkey, which is more troublesome, this article only introduces the offline drawing method. There are two methods for offline drawing: plotly.offline.plot() and plotly.offline.iplot(). The former generates an image file in html format in the current working directory in an offline way and opens it automatically;
 A symphony of data visualization: Create visual masterpieces with Python
Mar 09, 2024 am 10:07 AM
A symphony of data visualization: Create visual masterpieces with Python
Mar 09, 2024 am 10:07 AM
Data visualization is the process of transforming data into visual representations, allowing us to easily understand and analyze complex information. With python's powerful tools like Matplotlib and Seaborn, data visualization is easier than ever. Matplotlib: Basic Chart Library Matplotlib is the library of choice in Python for creating various chart types. It provides a wide range of functions to generate bar charts, line charts, scatter plots, pie charts, etc. Charts can be easily drawn and customized through the pyplot interface. For example, the following code draws a simple bar chart showing different categories of data: importmatplotlib.pyplotasplt
 Best practices for building data visualizations with Go and Plotly
Jun 17, 2023 pm 01:46 PM
Best practices for building data visualizations with Go and Plotly
Jun 17, 2023 pm 01:46 PM
Best practices for building visual data using Go and Plotly In practical applications, data visualization can display information such as data characteristics and trends, helping people understand the data more intuitively. Both the Go language and Plotly provide powerful tools for data visualization. Through this article, we will introduce the best practices for building data visualizations using Go and Plotly. 1. Install and configure Go and Plotly. First, you need to install the Go language and Plotly's Go library. You can use the following command to
 The Eyes of Data: Create Compelling Visualizations with Python
Mar 09, 2024 am 10:01 AM
The Eyes of Data: Create Compelling Visualizations with Python
Mar 09, 2024 am 10:01 AM
Data visualization is critical to understanding and communicating data insights. It allows us to transform complex data sets into easy-to-understand and engaging charts and graphs. As a versatile programming language, python provides a wealth of tools for creating engaging data visualizations, including libraries such as Matplotlib and Seaborn. Getting Started: MatplotlibMatplotlib is one of the most popular data visualization libraries in Python. It allows us to create various types of charts, including line charts, scatter plots, and histograms. The following example demonstrates how to create a line chart using Matplotlib: importmatplotlib.pyplotasplt#
