
 System Tutorial
MAC
360 Browser How to delete search engine on Mac - Method to delete search engine
System Tutorial
MAC
360 Browser How to delete search engine on Mac - Method to delete search engine
360 Browser How to delete search engine on Mac - Method to delete search engine

php editor Yuzai will introduce to you how to delete the search engine in Mac on 360 Browser. Deleting search engines can help you clean up unnecessary search options and improve browsing efficiency. The following will introduce the method of deleting search engines in detail, allowing you to operate easily and solve the problem quickly.
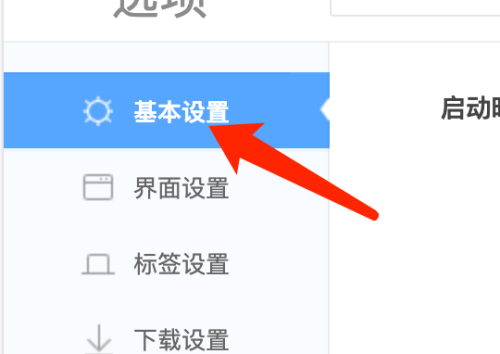
Step 1: After opening the settings page of 360 Browser, click Basic Settings.
Step 2: In the basic settings page, click Manage Search Engines.

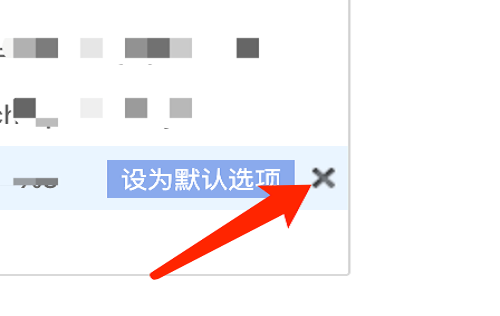
Step 3: On the search engine page, click the delete button to delete the search engine.
The above is the detailed content of 360 Browser How to delete search engine on Mac - Method to delete search engine. For more information, please follow other related articles on the PHP Chinese website!

Hot AI Tools

Undresser.AI Undress
AI-powered app for creating realistic nude photos

AI Clothes Remover
Online AI tool for removing clothes from photos.

Undress AI Tool
Undress images for free

Clothoff.io
AI clothes remover

Video Face Swap
Swap faces in any video effortlessly with our completely free AI face swap tool!

Hot Article
Hot Tools

Notepad++7.3.1
Easy-to-use and free code editor

SublimeText3 Chinese version
Chinese version, very easy to use

Zend Studio 13.0.1
Powerful PHP integrated development environment

Dreamweaver CS6
Visual web development tools

SublimeText3 Mac version
God-level code editing software (SublimeText3)
Hot Topics


 What is apache server? What is apache server for?
Apr 13, 2025 am 11:57 AM
What is apache server? What is apache server for?
Apr 13, 2025 am 11:57 AM
Apache server is a powerful web server software that acts as a bridge between browsers and website servers. 1. It handles HTTP requests and returns web page content based on requests; 2. Modular design allows extended functions, such as support for SSL encryption and dynamic web pages; 3. Configuration files (such as virtual host configurations) need to be carefully set to avoid security vulnerabilities, and optimize performance parameters, such as thread count and timeout time, in order to build high-performance and secure web applications.
 Solve caching issues in Craft CMS: Using wiejeben/craft-laravel-mix plug-in
Apr 18, 2025 am 09:24 AM
Solve caching issues in Craft CMS: Using wiejeben/craft-laravel-mix plug-in
Apr 18, 2025 am 09:24 AM
When developing websites using CraftCMS, you often encounter resource file caching problems, especially when you frequently update CSS and JavaScript files, old versions of files may still be cached by the browser, causing users to not see the latest changes in time. This problem not only affects the user experience, but also increases the difficulty of development and debugging. Recently, I encountered similar troubles in my project, and after some exploration, I found the plugin wiejeben/craft-laravel-mix, which perfectly solved my caching problem.
 Tips for using HDFS file system on CentOS
Apr 14, 2025 pm 07:30 PM
Tips for using HDFS file system on CentOS
Apr 14, 2025 pm 07:30 PM
The Installation, Configuration and Optimization Guide for HDFS File System under CentOS System This article will guide you how to install, configure and optimize Hadoop Distributed File System (HDFS) on CentOS System. HDFS installation and configuration Java environment installation: First, make sure that the appropriate Java environment is installed. Edit /etc/profile file, add the following, and replace /usr/lib/java-1.8.0/jdk1.8.0_144 with your actual Java installation path: exportJAVA_HOME=/usr/lib/java-1.8.0/jdk1.8.0_144exportPATH=$J
 Nginx performance monitoring and troubleshooting tools
Apr 13, 2025 pm 10:00 PM
Nginx performance monitoring and troubleshooting tools
Apr 13, 2025 pm 10:00 PM
Nginx performance monitoring and troubleshooting are mainly carried out through the following steps: 1. Use nginx-V to view version information, and enable the stub_status module to monitor the number of active connections, requests and cache hit rate; 2. Use top command to monitor system resource occupation, iostat and vmstat monitor disk I/O and memory usage respectively; 3. Use tcpdump to capture packets to analyze network traffic and troubleshoot network connection problems; 4. Properly configure the number of worker processes to avoid insufficient concurrent processing capabilities or excessive process context switching overhead; 5. Correctly configure Nginx cache to avoid improper cache size settings; 6. By analyzing Nginx logs, such as using awk and grep commands or ELK
 How to view thread status in Tomcat log
Apr 13, 2025 am 08:36 AM
How to view thread status in Tomcat log
Apr 13, 2025 am 08:36 AM
To view the thread status in the Tomcat log, you can use the following methods: TomcatManagerWeb interface: Enter the management address of Tomcat (usually http://localhost:8080/manager) in the browser, and you can view the status of the thread pool after logging in. JMX Monitoring: Use JMX monitoring tools (such as JConsole) to connect to Tomcat's MBean server to view the status of Tomcat's thread pool. Select in JConsole
 How to monitor HDFS status on CentOS
Apr 14, 2025 pm 07:33 PM
How to monitor HDFS status on CentOS
Apr 14, 2025 pm 07:33 PM
There are many ways to monitor the status of HDFS (Hadoop Distributed File System) on CentOS systems. This article will introduce several commonly used methods to help you choose the most suitable solution. 1. Use Hadoop’s own WebUI, Hadoop’s own Web interface to provide cluster status monitoring function. Steps: Make sure the Hadoop cluster is up and running. Access the WebUI: Enter http://:50070 (Hadoop2.x) or http://:9870 (Hadoop3.x) in your browser. The default username and password are usually hdfs/hdfs. 2. Command line tool monitoring Hadoop provides a series of command line tools to facilitate monitoring
 How to configure HTTPS server in Debian OpenSSL
Apr 13, 2025 am 11:03 AM
How to configure HTTPS server in Debian OpenSSL
Apr 13, 2025 am 11:03 AM
Configuring an HTTPS server on a Debian system involves several steps, including installing the necessary software, generating an SSL certificate, and configuring a web server (such as Apache or Nginx) to use an SSL certificate. Here is a basic guide, assuming you are using an ApacheWeb server. 1. Install the necessary software First, make sure your system is up to date and install Apache and OpenSSL: sudoaptupdatesudoaptupgradesudoaptinsta
 Nginx log analysis and statistics to understand website access
Apr 13, 2025 pm 10:06 PM
Nginx log analysis and statistics to understand website access
Apr 13, 2025 pm 10:06 PM
This article describes how to analyze Nginx logs to improve website performance and user experience. 1. Understand the Nginx log format, such as timestamps, IP addresses, status codes, etc.; 2. Use tools such as awk to parse logs and count indicators such as visits, error rates, etc.; 3. Write more complex scripts according to needs or use more advanced tools, such as goaccess, to analyze data from different dimensions; 4. For massive logs, consider using distributed frameworks such as Hadoop or Spark. By analyzing logs, you can identify website access patterns, improve content strategies, and ultimately optimize website performance and user experience.
