

MySQL按年龄段查询_MySQL

下面是项目中按照男女年龄段统计的核心sql代码:
COUNT(tr.id)AS '体检总人数', SUM(CASE WHEN s.sex=1 THEN 1 ELSE 0 END) AS '男体检总数', SUM(CASE WHEN s.sex=0 THEN 1 ELSE 0 END) AS '女体检总数', SUM(CASE WHEN s.sex=1 AND tr.age >=18 AND tr.age <=29 THEN 1 ELSE 0 END) AS '男18--29岁', SUM(CASE WHEN s.sex=0 AND tr.age >=18 AND tr.age<=29 THEN 1 ELSE 0 END) AS '女18--29岁', SUM(CASE WHEN s.sex=1 AND tr.age <=45 AND tr.age>=30 THEN 1 ELSE 0 END) AS '男30--39岁', SUM(CASE WHEN s.sex=0 AND tr.age<=45 AND tr.age>=30 THEN 1 ELSE 0 END) AS '女30--39岁', SUM(CASE WHEN s.sex=1 AND tr.age <=50 AND tr.age>=46 THEN 1 ELSE 0 END) AS '男40--49岁', SUM(CASE WHEN s.sex=0 AND tr.age<=50 AND tr.age>=46 THEN 1 ELSE 0 END) AS '女40--49岁', SUM(CASE WHEN s.sex=1 AND tr.age <=60 AND tr.age>50 THEN 1 ELSE 0 END) AS '男50--59岁', SUM(CASE WHEN s.sex=0 AND tr.age<=60 AND tr.age>50 THEN 1 ELSE 0 END) AS '女50--59岁', SUM(CASE WHEN s.sex=1 AND tr.age <=70 AND tr.age>60 THEN 1 ELSE 0 END) AS '男60--69岁', SUM(CASE WHEN s.sex=0 AND tr.age<=70 AND tr.age>60 THEN 1 ELSE 0 END) AS '女60--69岁', SUM(CASE WHEN s.sex=1 AND tr.age <=80 AND tr.age>70 THEN 1 ELSE 0 END) AS '男70--79岁', SUM(CASE WHEN s.sex=0 AND tr.age<=80 AND tr.age>70 THEN 1 ELSE 0 END) AS '女70--79岁', SUM(CASE WHEN s.sex=1 AND tr.age >80 THEN 1 ELSE 0 END) AS '男80岁以上', SUM(CASE WHEN s.sex=0 AND tr.age>80 THEN 1 ELSE 0 END) AS '女80岁以上'
我拿其中一句解释一下
SUM(CASE WHEN s.sex=1 AND tr.age >=18 AND tr.age
先看sum的括号里面的部分
case when sex = 1 and age>=18 and age
它表示的含义是:如果性别为1(也就是男),并且年龄在18-29岁之间成立为1,不成立为0.
case和end 是一个关键字你可以理解为语句的开始和结束。
when相当于if做判断,then就是判断之后显示的结果。如果成立显示为1,不成立显示为0
sum就是将各个值相加。形如:1+1+0+1+0+1+1+0+1+1
项目最后统计的结果截图形如:


Hot AI Tools

Undresser.AI Undress
AI-powered app for creating realistic nude photos

AI Clothes Remover
Online AI tool for removing clothes from photos.

Undress AI Tool
Undress images for free

Clothoff.io
AI clothes remover

Video Face Swap
Swap faces in any video effortlessly with our completely free AI face swap tool!

Hot Article
Hot Tools

Notepad++7.3.1
Easy-to-use and free code editor

SublimeText3 Chinese version
Chinese version, very easy to use

Zend Studio 13.0.1
Powerful PHP integrated development environment

Dreamweaver CS6
Visual web development tools

SublimeText3 Mac version
God-level code editing software (SublimeText3)
Hot Topics


 Share an easy way to package PyCharm projects
Dec 30, 2023 am 09:34 AM
Share an easy way to package PyCharm projects
Dec 30, 2023 am 09:34 AM
Share the simple and easy-to-understand PyCharm project packaging method. With the popularity of Python, more and more developers use PyCharm as the main tool for Python development. PyCharm is a powerful integrated development environment that provides many convenient functions to help us improve development efficiency. One of the important functions is project packaging. This article will introduce how to package projects in PyCharm in a simple and easy-to-understand way, and provide specific code examples. Why package projects? Developed in Python
 Can AI conquer Fermat's last theorem? Mathematician gave up 5 years of his career to turn 100 pages of proof into code
Apr 09, 2024 pm 03:20 PM
Can AI conquer Fermat's last theorem? Mathematician gave up 5 years of his career to turn 100 pages of proof into code
Apr 09, 2024 pm 03:20 PM
Fermat's last theorem, about to be conquered by AI? And the most meaningful part of the whole thing is that Fermat’s Last Theorem, which AI is about to solve, is precisely to prove that AI is useless. Once upon a time, mathematics belonged to the realm of pure human intelligence; now, this territory is being deciphered and trampled by advanced algorithms. Image Fermat's Last Theorem is a "notorious" puzzle that has puzzled mathematicians for centuries. It was proven in 1993, and now mathematicians have a big plan: to recreate the proof using computers. They hope that any logical errors in this version of the proof can be checked by a computer. Project address: https://github.com/riccardobrasca/flt
 A closer look at PyCharm: a quick way to delete projects
Feb 26, 2024 pm 04:21 PM
A closer look at PyCharm: a quick way to delete projects
Feb 26, 2024 pm 04:21 PM
Title: Learn more about PyCharm: An efficient way to delete projects. In recent years, Python, as a powerful and flexible programming language, has been favored by more and more developers. In the development of Python projects, it is crucial to choose an efficient integrated development environment. As a powerful integrated development environment, PyCharm provides Python developers with many convenient functions and tools, including deleting project directories quickly and efficiently. The following will focus on how to use delete in PyCharm
 PyCharm Practical Tips: Convert Project to Executable EXE File
Feb 23, 2024 am 09:33 AM
PyCharm Practical Tips: Convert Project to Executable EXE File
Feb 23, 2024 am 09:33 AM
PyCharm is a powerful Python integrated development environment that provides a wealth of development tools and environment configurations, allowing developers to write and debug code more efficiently. In the process of using PyCharm for Python project development, sometimes we need to package the project into an executable EXE file to run on a computer that does not have a Python environment installed. This article will introduce how to use PyCharm to convert a project into an executable EXE file, and give specific code examples. head
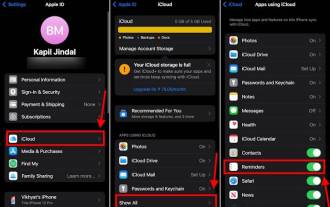 How to Make a Shopping List in the iOS 17 Reminders App on iPhone
Sep 21, 2023 pm 06:41 PM
How to Make a Shopping List in the iOS 17 Reminders App on iPhone
Sep 21, 2023 pm 06:41 PM
How to Make a GroceryList on iPhone in iOS17 Creating a GroceryList in the Reminders app is very simple. You just add a list and populate it with your items. The app automatically sorts your items into categories, and you can even work with your partner or flat partner to make a list of what you need to buy from the store. Here are the full steps to do this: Step 1: Turn on iCloud Reminders As strange as it sounds, Apple says you need to enable reminders from iCloud to create a GroceryList on iOS17. Here are the steps for it: Go to the Settings app on your iPhone and tap [your name]. Next, select i
 How to implement data statistics and analysis in uniapp
Oct 24, 2023 pm 12:37 PM
How to implement data statistics and analysis in uniapp
Oct 24, 2023 pm 12:37 PM
How to implement data statistics and analysis in uniapp 1. Background introduction Data statistics and analysis are a very important part of the mobile application development process. Through statistics and analysis of user behavior, developers can have an in-depth understanding of user preferences and usage habits. Thereby optimizing product design and user experience. This article will introduce how to implement data statistics and analysis functions in uniapp, and provide some specific code examples. 2. Choose appropriate data statistics and analysis tools. The first step to implement data statistics and analysis in uniapp is to choose the appropriate data statistics and analysis tools.
 Implementation of linear and pie chart functions in Vue statistical charts
Aug 19, 2023 pm 06:13 PM
Implementation of linear and pie chart functions in Vue statistical charts
Aug 19, 2023 pm 06:13 PM
The linear and pie chart functions of Vue statistical charts are implemented in the field of data analysis and visualization. Statistical charts are a very commonly used tool. As a popular JavaScript framework, Vue provides convenient methods to implement various functions, including the display and interaction of statistical charts. This article will introduce how to use Vue to implement linear and pie chart functions, and provide corresponding code examples. Linear graph function implementation A linear graph is a type of chart used to display trends and changes in data. In Vue, we can use some excellent
 How to use SQL statements for data aggregation and statistics in MySQL?
Dec 17, 2023 am 08:41 AM
How to use SQL statements for data aggregation and statistics in MySQL?
Dec 17, 2023 am 08:41 AM
How to use SQL statements for data aggregation and statistics in MySQL? Data aggregation and statistics are very important steps when performing data analysis and statistics. As a powerful relational database management system, MySQL provides a wealth of aggregation and statistical functions, which can easily perform data aggregation and statistical operations. This article will introduce the method of using SQL statements to perform data aggregation and statistics in MySQL, and provide specific code examples. 1. Use the COUNT function for counting. The COUNT function is the most commonly used
