
 Technology peripherals
AI
In-depth analysis of the concepts and applications of multiple linear regression models
Technology peripherals
AI
In-depth analysis of the concepts and applications of multiple linear regression models
In-depth analysis of the concepts and applications of multiple linear regression models

Multiple linear regression is the most common form of linear regression and is used to describe how a single response variable Y exhibits a linear relationship with multiple predictor variables.
Examples of applications where multiple regression can be used:
The selling price of a house can be affected by factors such as location, number of bedrooms and bathrooms, year of construction, lot size, and more.
2. The height of a child depends on the height of the mother, the height of the father, nutrition and environmental factors.
Multiple linear regression model parameters
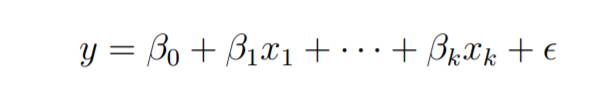
Consider a multiple linear regression model with k independent predictor variables x1, x2..., xk and a response variable y.
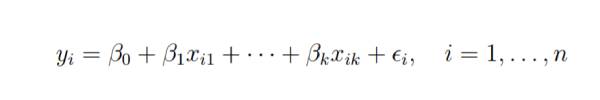
Suppose we have n observations for k 1 variables, and n variables should be greater than k.
The basic goal of least squares regression is to fit the hyperplane into the (k 1)-dimensional space to minimize the sum of squared residuals .

#Before differentiating the model parameters, set them to zero and derive the least squares normal equation that the parameters must satisfy.
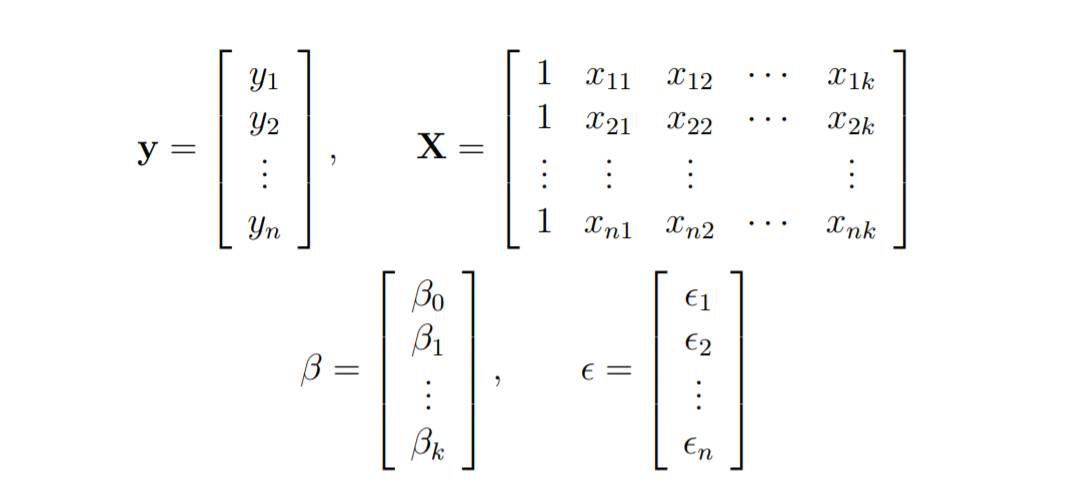
These equations are formulated with the help of vectors and matrices.
The linear regression model is written as follows:

Online In linear regression, least squares parameter estimation b

Imagine that the columns of changing. We wish to find the "best" b that minimizes the sum of squared residuals.
The smallest possible sum of squares is zero.

Here y is the estimated response vector.
The code implements multiple linear regression on the data set data2
data2 data set
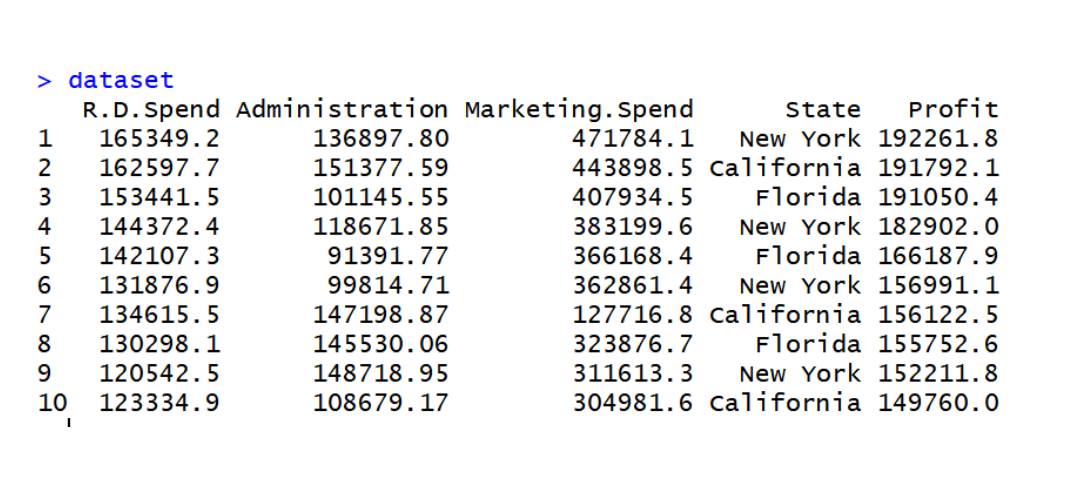
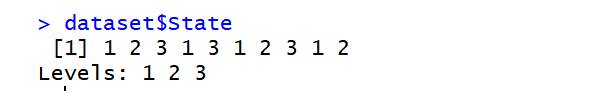
dataset=read.csv('data2.csv')
dataset$State=factor(dataset$State,
levels=c('New York','California','Florida'),
labels=c(1,2,3))
dataset$State
library(caTools)
set.seed(123)
split=sample.split(dataset$Profit,SplitRatio=0.8)
training_set=subset(dataset,split==TRUE)
test_set=subset(dataset,split==FALSE)
regressor=lm(formula=Profit~.,
data=training_set)
y_pred=predict(regressor,newdata=test_set)
The above is the detailed content of In-depth analysis of the concepts and applications of multiple linear regression models. For more information, please follow other related articles on the PHP Chinese website!

Hot AI Tools

Undresser.AI Undress
AI-powered app for creating realistic nude photos

AI Clothes Remover
Online AI tool for removing clothes from photos.

Undress AI Tool
Undress images for free

Clothoff.io
AI clothes remover

Video Face Swap
Swap faces in any video effortlessly with our completely free AI face swap tool!

Hot Article
Hot Tools

Notepad++7.3.1
Easy-to-use and free code editor

SublimeText3 Chinese version
Chinese version, very easy to use

Zend Studio 13.0.1
Powerful PHP integrated development environment

Dreamweaver CS6
Visual web development tools

SublimeText3 Mac version
God-level code editing software (SublimeText3)
Hot Topics
 1662
1662
 14
1418
52
1311
25
1261
29
1234
24
14
1418
52
1311
25
1261
29
1234
24

 In-depth analysis of the concepts and applications of multiple linear regression models
Jan 22, 2024 pm 06:30 PM
In-depth analysis of the concepts and applications of multiple linear regression models
Jan 22, 2024 pm 06:30 PM
Multiple linear regression is the most common form of linear regression and is used to describe how a single response variable Y exhibits a linear relationship with multiple predictor variables. Examples of applications where multiple regression can be used: The selling price of a house can be affected by factors such as location, number of bedrooms and bathrooms, year of construction, lot size, etc. 2. The height of a child depends on the height of the mother, the height of the father, nutrition and environmental factors. Multiple Linear Regression Model Parameters Consider a multiple linear regression model with k independent predictor variables x1, x2..., xk and a response variable y. Suppose we have n observations for k+1 variables, and n variables should be greater than k. The basic goal of least squares regression is to fit the hyperplane into the (k+1)-dimensional space to minimize the sum of squared residuals. on model
 Detailed explanation of linear regression model in Python
Jun 10, 2023 pm 12:28 PM
Detailed explanation of linear regression model in Python
Jun 10, 2023 pm 12:28 PM
Detailed explanation of linear regression model in Python Linear regression is a classic statistical model and machine learning algorithm. It is widely used in the fields of prediction and modeling, such as stock market prediction, weather prediction, housing price prediction, etc. As an efficient programming language, Python provides a rich machine learning library, including linear regression models. This article will introduce the linear regression model in Python in detail, including model principles, application scenarios and code implementation. Principle of linear regression The linear regression model is based on the linear relationship between variables.
 The top ten algorithms you must know and know about machine learning!
Apr 12, 2023 am 09:34 AM
The top ten algorithms you must know and know about machine learning!
Apr 12, 2023 am 09:34 AM
1. Linear Regression Linear Regression is probably the most popular machine learning algorithm. Linear regression is to find a straight line and make this straight line fit the data points in the scatter plot as closely as possible. It attempts to represent the independent variables (x values) and numerical results (y values) by fitting a straight line equation to this data. This line can then be used to predict future values! The most commonly used technique for this algorithm is the least squares method. This method calculates a line of best fit that minimizes the perpendicular distance from each data point on the line. The total distance is the sum of the squares of the vertical distances (green line) of all data points. The idea is to fit the model by minimizing this squared error or distance. For example
 Tikhonov regularization
Jan 23, 2024 am 09:33 AM
Tikhonov regularization
Jan 23, 2024 am 09:33 AM
Tikhonov regularization, also known as ridge regression or L2 regularization, is a regularization method used for linear regression. It controls the complexity and generalization ability of the model by adding an L2 norm penalty term to the objective function of the model. This penalty term penalizes the weight of the model by the sum of squares to avoid excessive weight, thereby mitigating the overfitting problem. This method introduces a regularization term into the loss function and adjusts the regularization coefficient to balance the fitting ability and generalization ability of the model. Tikhonov regularization has a wide range of applications in practical applications and can effectively improve the performance and stability of the model. Before regularization, the objective function of linear regression can be expressed as: J(w)=\frac{1}{2m}\sum_{i=1}^{m}(h_
 Polynomial Regression Properties of Linear and Nonlinear Analysis
Jan 22, 2024 pm 03:03 PM
Polynomial Regression Properties of Linear and Nonlinear Analysis
Jan 22, 2024 pm 03:03 PM
Polynomial regression is a regression analysis method suitable for nonlinear data relationships. Unlike simple linear regression models that can only fit straight-line relationships, polynomial regression models can fit complex curvilinear relationships more accurately. It introduces polynomial features and adds high-order terms of variables to the model to better adapt to nonlinear changes in data. This approach improves model flexibility and fit, allowing for more accurate predictions and interpretation of data. The basic form of the polynomial regression model is: y=β0+β1x+β2x^2+…+βn*x^n+ε. In this model, y is the dependent variable we want to predict, and x is the independent variable. β0~βn are the coefficients of the model, which determine the degree of influence of the independent variables on the dependent variables. ε represents the error term of the model, which is determined by the inability to
 Detailed explanation of the definition, meaning and calculation of OR value in logistic regression
Jan 23, 2024 pm 12:48 PM
Detailed explanation of the definition, meaning and calculation of OR value in logistic regression
Jan 23, 2024 pm 12:48 PM
Logistic regression is a linear model used for classification problems, mainly used to predict probability values in binary classification problems. It converts linear prediction values into probability values by using the sigmoid function and makes classification decisions based on thresholds. In logistic regression, the OR value is an important indicator used to measure the impact of different variables in the model on the results. The OR value represents the multiple change in the probability of the dependent variable occurring for a unit change in the independent variable. By calculating the OR value, we can determine the contribution of a certain variable to the model. The calculation method of the OR value is to take the coefficient of the natural logarithm (ln) of the exponential function (exp), that is, OR=exp(β), where β is the coefficient of the independent variable in the logistic regression model. Tool
 Logistic regression analysis model
Jan 22, 2024 pm 04:09 PM
Logistic regression analysis model
Jan 22, 2024 pm 04:09 PM
Logistic regression model is a classification model used to predict the probability of binary variables. It is based on a linear regression model and implements classification tasks by converting the output of linear regression into predicted probabilities. Logistic regression models play an important role in predicting the probability of binary variables. It is widely used in various classification problems, such as predicting the rise and fall of the stock market, whether credit card holders will default, etc. In addition, the logistic regression model can also be used for feature selection, that is, selecting features that have a significant impact on the prediction results. In addition, the logistic regression model can also be used for visualization by drawing ROC curves to evaluate model performance. In this way, we can intuitively understand the predictive power of the model. Logistic regression
 Understand the definition of a generalized linear model
Jan 23, 2024 pm 05:21 PM
Understand the definition of a generalized linear model
Jan 23, 2024 pm 05:21 PM
Generalized Linear Model (GLM) is a statistical learning method used to describe and analyze the relationship between dependent variables and independent variables. Traditional linear regression models can only handle continuous numerical variables, while GLM can be extended to handle more types of variables, including binary, multivariate, count or categorical variables. The core idea of GLM is to relate the expected value of the dependent variable to the linear combination of the independent variables through a suitable link function, while using a suitable error distribution to describe the variability of the dependent variable. In this way, GLM can adapt to different types of data, further improving the flexibility and predictive power of the model. By choosing appropriate link functions and error distributions, GLM can be adapted to
