
 Backend Development
Python Tutorial
Analyze the concise steps of matplotlib scatter plot drawing
Backend Development
Python Tutorial
Analyze the concise steps of matplotlib scatter plot drawing
Analyze the concise steps of matplotlib scatter plot drawing


Quick Start: Analysis of matplotlib scatter plot drawing steps
Introduction:
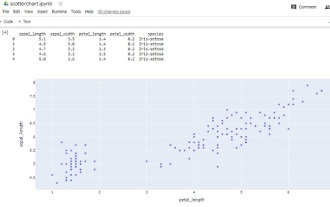
matplotlib is a powerful Python data visualization library that can be used to draw various types of chart. Among them, scatter plot is a commonly used chart type used to show the relationship between data points. This article will introduce the steps of using matplotlib to draw a scatter plot, along with specific code examples to help readers get started quickly.
Step 1: Import the required libraries
First, we need to import the matplotlib library and other libraries that may need to be used. In the Python code, use the import keyword to import the required library, as shown below:
import matplotlib.pyplot as plt
import numpy as np
The above code will import the matplotlib.pyplot library and rename it to plt to facilitate subsequent calls. At the same time, we also imported the numpy library and renamed it np to facilitate related numerical calculations.
Step 2: Prepare data
Before drawing the scatter plot, we need to prepare the data to be drawn. Typically, data exists as one-to-one pairs of x and y coordinates. For convenience, we can use the random function of the numpy library to generate some random data as an example. Here is a sample code to generate data:
# 生成随机数据
np.random.seed(0)  # 设置随机种子,保证结果可复现
x = np.random.rand(50)
y = np.random.rand(50)
The above code will generate data containing 50 random x-coordinate values and 50 random y-coordinate values.
Step 3: Draw a scatter plot
After we have the data, we can use the matplotlib.pyplot library to draw a scatter plot. The function for drawing a scatter plot is scatter(), which needs to pass two parameters x and y as input. The following is a sample code for drawing a scatter plot:
# 绘制散点图
plt.scatter(x, y)
plt.xlabel('x')
plt.ylabel('y')
plt.title('Scatter Plot')
plt.show()The above code will draw a scatter plot containing 50 random data points. Among them, the plt.xlabel() function and plt.ylabel() function are used to set the labels of the x-axis and y-axis, the plt.title() function is used to set the title of the chart, and the plt.show() function is used to display the chart.
Step 4: Customize the scatter plot
matplotlib also provides a wealth of parameters and options to customize the scatter plot. Here are some examples of commonly used customization options:
Adjust the size of the points:
plt.scatter(x, y, s=50) # 设置点的大小为50
Copy after loginAdjust the color of the points:
plt.scatter(x, y, c='r') # 设置点的颜色为红色
Copy after loginAdd color map:
colors = np.random.rand(50)
plt.scatter(x, y, c=colors, cmap='rainbow')  # 使用彩虹色映射
Copy after loginAdd marker shape:
plt.scatter(x, y, marker='s') # 使用正方形标记
Copy after loginAdd legend:
plt.scatter(x, y, label='Data')
plt.legend()  # 显示图例
Copy after loginThrough these customization options, we can personalize the scatter plot according to actual needs to meet different needs.
Summary:
This article introduces in detail the method of drawing scatter plots using the matplotlib library through four steps, and provides specific code examples. Readers can follow these steps and examples to practice and deepen their understanding and mastery of drawing scatter plots with the matplotlib library. I hope this article will help readers quickly get started with matplotlib scatter plots.The above is the detailed content of Analyze the concise steps of matplotlib scatter plot drawing. For more information, please follow other related articles on the PHP Chinese website!

Hot AI Tools

Undresser.AI Undress
AI-powered app for creating realistic nude photos

AI Clothes Remover
Online AI tool for removing clothes from photos.

Undress AI Tool
Undress images for free

Clothoff.io
AI clothes remover

Video Face Swap
Swap faces in any video effortlessly with our completely free AI face swap tool!

Hot Article
Hot Tools

Notepad++7.3.1
Easy-to-use and free code editor

SublimeText3 Chinese version
Chinese version, very easy to use

Zend Studio 13.0.1
Powerful PHP integrated development environment

Dreamweaver CS6
Visual web development tools

SublimeText3 Mac version
God-level code editing software (SublimeText3)
Hot Topics


 Python learning: How to install the pandas library in the system
Jan 09, 2024 pm 04:42 PM
Python learning: How to install the pandas library in the system
Jan 09, 2024 pm 04:42 PM
Quick Start: How to install the pandas library in Python requires specific code examples 1. Overview Python is a widely used programming language with a powerful development ecosystem that includes many practical libraries. Pandas is one of the most popular data analysis libraries. It provides efficient data structures and data analysis tools, making data processing and analysis easier. This article will introduce how to install the pandas library in Python and provide corresponding code examples. 2. Install Py
 How to make a basic scatter plot using Python-Plotly?
Aug 31, 2023 pm 01:37 PM
How to make a basic scatter plot using Python-Plotly?
Aug 31, 2023 pm 01:37 PM
Sometimes the task is to analyze a data set and visualize the data using charts or plots. Plotly is a great open source graphics library that can be used with Python for making a variety of plots and charts quickly and easily. In this article, using two different examples, a Python library called Plotly is used with Python code to plot a scatter plot. In the first example, the Python installed in the computer system is used to run a Python program written to make a scatter plot. Another example, using Google Colab, shows how you can still use Python and Plotly and make scatter plots without Python installed on your computer. In these two
 Quick Start with the Mojs Animation Library: A Guide to the Explosion Module
Sep 02, 2023 pm 11:49 PM
Quick Start with the Mojs Animation Library: A Guide to the Explosion Module
Sep 02, 2023 pm 11:49 PM
We start this series by learning how to animate HTML elements using mojs. In this second tutorial, we continue using the Shape module to animate built-in SVG shapes. The third tutorial covers more ways to animate SVG shapes using ShapeSwirl and the stagger module. Now we will learn how to animate different SVG shapes in bursts using the Burst module. This tutorial will depend on the concepts we introduced in the previous three tutorials. If you haven't read them yet, I recommend reading them first. Creating a Basic Burst Animation The first thing we need to do before creating any burst animation is to instantiate a Burst object. Afterwards, we can specify different properties
 Implementation of area chart and scatter chart functions of Vue statistical chart
Aug 20, 2023 am 11:58 AM
Implementation of area chart and scatter chart functions of Vue statistical chart
Aug 20, 2023 am 11:58 AM
The area chart and scatter chart functions of Vue statistical charts are implemented. With the continuous development of data visualization technology, statistical charts play an important role in data analysis and display. Under the Vue framework, we can use the existing chart library and combine it with Vue's two-way data binding and componentization features to easily implement the functions of area charts and scatter charts. This article will introduce how to use Vue and commonly used chart libraries to implement these two statistical charts. Implementation of area charts Area charts are often used to show the trend of data changes over time. In Vue, we can use v
 Quick Start: Use Go language functions to implement a simple audio streaming service
Jul 29, 2023 pm 11:45 PM
Quick Start: Use Go language functions to implement a simple audio streaming service
Jul 29, 2023 pm 11:45 PM
Quick Start: Implementing a Simple Audio Streaming Service Using Go Language Functions Introduction: Audio streaming services are becoming more and more popular in today's digital world, which allow us to play audio files directly over the network without performing a complete download. This article will introduce how to use Go language functions to quickly implement a simple audio streaming service so that you can better understand and use this function. Step 1: Preparation First, you need to install the Go language development environment. You can download it from the official website (https://golan
 Quick Start: Use Go language functions to implement simple image recognition functions
Jul 30, 2023 pm 09:49 PM
Quick Start: Use Go language functions to implement simple image recognition functions
Jul 30, 2023 pm 09:49 PM
Quick Start: Use Go language functions to implement simple image recognition functions In today's technological development, image recognition technology has become a hot topic. As a fast and efficient programming language, Go language has the ability to implement image recognition functions. This article will provide readers with a quick start guide by using Go language functions to implement simple image recognition functions. First, we need to install the Go language development environment. You can download the appropriate version on the Go language official website (https://golang.org/)
 Quick Start: Use Go language functions to implement a simple video streaming service
Aug 01, 2023 pm 02:29 PM
Quick Start: Use Go language functions to implement a simple video streaming service
Aug 01, 2023 pm 02:29 PM
Quick Start: Implementing a Simple Video Streaming Service Using Go Language Functions Introduction: Video streaming services play an important role in modern applications. This article will introduce how to use Go language functions to implement a simple video streaming service. We will use the net/http package of Go language to handle HTTP requests, and combine it with the FFmpeg library to handle the encoding and decoding of video streams. Step 1: Install FFmpeg Before we start writing code, we need to install the FFmpeg library. Can be accessed through FFmpeg official website
 Quick Start: Use Go language functions to implement simple data aggregation functions
Jul 29, 2023 pm 02:06 PM
Quick Start: Use Go language functions to implement simple data aggregation functions
Jul 29, 2023 pm 02:06 PM
Quick Start: Use Go language functions to implement simple data aggregation functions. In software development, we often encounter situations where we need to aggregate a set of data. Aggregation operations can count, summarize, calculate, etc., to analyze and display data. In the Go language, we can use functions to implement simple data aggregation functions. First, we need to define a data type to represent the data we want to aggregate. Suppose we have a student's grade table, and each student has two fields: name and grade, then we can create the following structure
