

What are the kafka visualization tools?

kafka visualization tools include: 1. Kafka Manager; 2. Kafka Tool; 3. Confluent Control Center; 4. Kafka Web Console; 5. Kafka Eagle; 6. Logstash; 7. Grafana; 8. Kafka Offset Monitor; 9. Spark Structured Streaming; 10. Msteams.

The operating system for this tutorial: Windows 10 system, DELL G3 computer.
Kafka’s visualization tools are mainly used to manage and monitor Kafka clusters, and view and analyze data flows in Kafka. The following are commonly used Kafka visualization tools:
1. Kafka Manager: This is an open source Kafka cluster management tool from Yahoo that provides a Web interface to manage and monitor Kafka clusters. It can help users track the status of topics and partitions, monitor indicators such as offsets and consumer groups, and provide some management operations, such as creating topics, manually rebalancing partitions, etc.
2. Kafka Tool: This is a cross-platform visualization tool for managing and monitoring Kafka clusters. It provides an intuitive interface to browse and view details of topics, partitions, and consumer groups.
3. Confluent Control Center: This is a commercial Kafka visualization and management tool provided by Confluent. It provides a wealth of functions, including real-time monitoring, alarms, log analysis, cluster management and other functions.
4. Kafka Web Console: This is an open source web interface tool used to manage and monitor Kafka clusters. It provides an intuitive interface to view the status and information of topics, partitions, and consumer groups.
5. Kafka Eagle: This is a monitoring and security visualization tool for Kafka clusters. It can help users monitor the performance indicators, logs, consumer group status, etc. of Kafka clusters in real time. .
6. Logstash: Although Logstash itself is not a visualization tool specifically for Kafka, it can ingest streams from logs, metrics, web applications, data stores, and various AWS services Data, and can be integrated with Kafka to import data streams into Kafka for processing and analysis.
7. Grafana: This is an open source, feature-rich metric dashboard and graph editor for Graphite, ElasticSearch, OpenTSDB, Prometheus and streaming databases. Grafana allows users to easily create and edit dashboards while allowing querying and visualizing metrics regardless of where the data is stored.
8. Kafka Offset Monitor: This is an open source tool for monitoring Kafka clusters. It can view the status, number of messages, offsets and other indicators of the Kafka cluster in real time, and provides Some management functions.
9. Spark Structured Streaming: Spark is a large-scale data processing framework, and its Structured Streaming component can be integrated with Kafka for real-time stream processing and visualization tools.
10. Msteams: This is a chat application that can integrate Kafka message flow into it to achieve real-time monitoring and visualization.
These tools have their own characteristics and advantages. Users can choose the appropriate tool to use according to the actual needs of the project.
The above is the detailed content of What are the kafka visualization tools?. For more information, please follow other related articles on the PHP Chinese website!

Hot AI Tools

Undresser.AI Undress
AI-powered app for creating realistic nude photos

AI Clothes Remover
Online AI tool for removing clothes from photos.

Undress AI Tool
Undress images for free

Clothoff.io
AI clothes remover

Video Face Swap
Swap faces in any video effortlessly with our completely free AI face swap tool!

Hot Article
Hot Tools

Notepad++7.3.1
Easy-to-use and free code editor

SublimeText3 Chinese version
Chinese version, very easy to use

Zend Studio 13.0.1
Powerful PHP integrated development environment

Dreamweaver CS6
Visual web development tools

SublimeText3 Mac version
God-level code editing software (SublimeText3)
Hot Topics


 How to implement real-time stock analysis using PHP and Kafka
Jun 28, 2023 am 10:04 AM
How to implement real-time stock analysis using PHP and Kafka
Jun 28, 2023 am 10:04 AM
With the development of the Internet and technology, digital investment has become a topic of increasing concern. Many investors continue to explore and study investment strategies, hoping to obtain a higher return on investment. In stock trading, real-time stock analysis is very important for decision-making, and the use of Kafka real-time message queue and PHP technology is an efficient and practical means. 1. Introduction to Kafka Kafka is a high-throughput distributed publish and subscribe messaging system developed by LinkedIn. The main features of Kafka are
 How to dynamically specify multiple topics with @KafkaListener in springboot+kafka
May 20, 2023 pm 08:58 PM
How to dynamically specify multiple topics with @KafkaListener in springboot+kafka
May 20, 2023 pm 08:58 PM
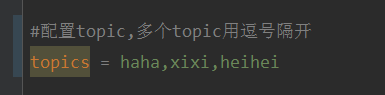
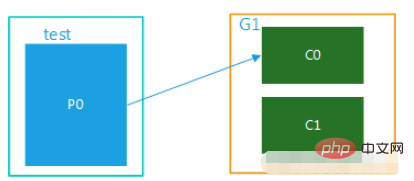
Explain that this project is a springboot+kafak integration project, so it uses the kafak consumption annotation @KafkaListener in springboot. First, configure multiple topics separated by commas in application.properties. Method: Use Spring’s SpEl expression to configure topics as: @KafkaListener(topics="#{’${topics}’.split(’,’)}") to run the program. The console printing effect is as follows
 How SpringBoot integrates Kafka configuration tool class
May 12, 2023 pm 09:58 PM
How SpringBoot integrates Kafka configuration tool class
May 12, 2023 pm 09:58 PM
spring-kafka is based on the integration of the java version of kafkaclient and spring. It provides KafkaTemplate, which encapsulates various methods for easy operation. It encapsulates apache's kafka-client, and there is no need to import the client to depend on the org.springframework.kafkaspring-kafkaYML configuration. kafka:#bootstrap-servers:server1:9092,server2:9093#kafka development address,#producer configuration producer:#serialization and deserialization class key provided by Kafka
 How to build real-time data processing applications using React and Apache Kafka
Sep 27, 2023 pm 02:25 PM
How to build real-time data processing applications using React and Apache Kafka
Sep 27, 2023 pm 02:25 PM
How to use React and Apache Kafka to build real-time data processing applications Introduction: With the rise of big data and real-time data processing, building real-time data processing applications has become the pursuit of many developers. The combination of React, a popular front-end framework, and Apache Kafka, a high-performance distributed messaging system, can help us build real-time data processing applications. This article will introduce how to use React and Apache Kafka to build real-time data processing applications, and
 Revealing five visualization tools to simplify Kafka operations
Jan 04, 2024 pm 12:11 PM
Revealing five visualization tools to simplify Kafka operations
Jan 04, 2024 pm 12:11 PM
Simplifying Kafka operations: Five easy-to-use visualization tools revealed Introduction: As a distributed stream processing platform, Kafka is favored by more and more enterprises. However, although Kafka has the advantages of high throughput, reliability, and scalability, its operational complexity has also become a major challenge for users. In order to simplify the operation of Kafka and improve developer productivity, many visualization tools have emerged. This article will introduce five easy-to-use Kafka visualization tools to help you navigate the world of Kafka with ease.
 Five selections of visualization tools for exploring Kafka
Feb 01, 2024 am 08:03 AM
Five selections of visualization tools for exploring Kafka
Feb 01, 2024 am 08:03 AM
Five options for Kafka visualization tools ApacheKafka is a distributed stream processing platform capable of processing large amounts of real-time data. It is widely used to build real-time data pipelines, message queues, and event-driven applications. Kafka's visualization tools can help users monitor and manage Kafka clusters and better understand Kafka data flows. The following is an introduction to five popular Kafka visualization tools: ConfluentControlCenterConfluent
 Comparative analysis of kafka visualization tools: How to choose the most appropriate tool?
Jan 05, 2024 pm 12:15 PM
Comparative analysis of kafka visualization tools: How to choose the most appropriate tool?
Jan 05, 2024 pm 12:15 PM
How to choose the right Kafka visualization tool? Comparative analysis of five tools Introduction: Kafka is a high-performance, high-throughput distributed message queue system that is widely used in the field of big data. With the popularity of Kafka, more and more enterprises and developers need a visual tool to easily monitor and manage Kafka clusters. This article will introduce five commonly used Kafka visualization tools and compare their features and functions to help readers choose the tool that suits their needs. 1. KafkaManager
 Sample code for springboot project to configure multiple kafka
May 14, 2023 pm 12:28 PM
Sample code for springboot project to configure multiple kafka
May 14, 2023 pm 12:28 PM
1.spring-kafkaorg.springframework.kafkaspring-kafka1.3.5.RELEASE2. Configuration file related information kafka.bootstrap-servers=localhost:9092kafka.consumer.group.id=20230321#The number of threads that can be consumed concurrently (usually consistent with the number of partitions )kafka.consumer.concurrency=10kafka.consumer.enable.auto.commit=falsekafka.boo
