
 Java
javaTutorial
ECharts and Java interface: how to apply statistical analysis in the field of intelligent manufacturing
Java
javaTutorial
ECharts and Java interface: how to apply statistical analysis in the field of intelligent manufacturing
ECharts and Java interface: how to apply statistical analysis in the field of intelligent manufacturing


ECharts and Java interface: How to apply statistical analysis in the field of intelligent manufacturing, specific code examples are needed
Intelligent manufacturing is an important development direction of today's manufacturing industry. Utilize advanced technology and information technology to improve production efficiency, quality and flexibility. Statistical analysis is an indispensable part of intelligent manufacturing, which can help companies monitor and optimize the production process. This article will introduce how to use ECharts and Java interfaces to perform statistical analysis in the field of intelligent manufacturing, and give specific code examples.
ECharts is an open source visualization library based on JavaScript. It provides a wealth of chart types and interactive functions, helping users quickly build a variety of charts. Java is a programming language widely used in enterprise-level application development. It has rich libraries and tools to process data and perform analysis. By combining ECharts and Java interfaces, we can perform various statistical analyzes in the field of intelligent manufacturing to provide enterprises with better decision-making basis.
First, we need to get the data and process it in Java. Suppose we have an intelligent manufacturing system that can collect and store various data in the production process in real time, such as temperature, humidity, pressure, etc. We can use Java's database connection library to connect to the database and write SQL statements to obtain the required data. The following is a sample code for obtaining temperature data:
import java.sql.*;

public class DataAnalysis {
    public static void main(String[] args) {
        try {
            // 连接数据库
            Connection conn = DriverManager.getConnection("jdbc:mysql://localhost:3306/production", "username", "password");

            // 执行SQL语句获取温度数据
            Statement stmt = conn.createStatement();
            String sql = "SELECT temperature FROM production_data WHERE production_line = 'A'";
            ResultSet rs = stmt.executeQuery(sql);

            // 处理数据
            while (rs.next()) {
                double temperature = rs.getDouble("temperature");
                // 对数据进行统计分析或其他处理
            }

            // 关闭数据库连接
            rs.close();
            stmt.close();
            conn.close();
        } catch (SQLException e) {
            e.printStackTrace();
        }
    }
}Through the above code, we can obtain temperature data from the database and perform further statistical analysis or other processing. Next, we need to convert the data into the format required by ECharts and use ECharts for visual display. The following is a sample code that converts temperature data into the JSON format required by ECharts and displays it in a histogram:
import com.github.abel533.echarts.Option;
import com.github.abel533.echarts.axis.CategoryAxis;
import com.github.abel533.echarts.code.Magic;

public class DataVisualization {
    public static void main(String[] args) {
        // 创建Option对象
        Option option = new Option();

        // 创建X轴和Y轴
        CategoryAxis xAxis = new CategoryAxis();
        xAxis.setName("时间");
        xAxis.setData(new String[]{"09:00", "09:10", "09:20", "09:30", "09:40"});
        option.xAxis(xAxis);

        com.github.abel533.echarts.axis.ValueAxis yAxis = new com.github.abel533.echarts.axis.ValueAxis();
        yAxis.setName("温度");
        yAxis.setMax(100);
        option.yAxis(yAxis);

        // 添加数据
        option.series(Magic.bar, new com.github.abel533.echarts.series.Bar().setData(new int[]{20, 30, 40, 50, 60}));

        // 输出JSON格式
        System.out.println(option.toString());
    }
}Through the above code, we can convert the temperature data into the JSON format required by ECharts and display it in the The console outputs the JSON string. This string can be used directly in the js code of the front-end page, using the ECharts library for chart drawing and interaction.
To sum up, this article introduces how to apply ECharts and Java interfaces to statistical analysis in the field of intelligent manufacturing, and gives specific code examples. Through the combination of ECharts and Java, we can easily process and visualize data, providing better decision-making support for intelligent manufacturing. I hope this article can be helpful to readers in statistical analysis in the field of intelligent manufacturing.
The above is the detailed content of ECharts and Java interface: how to apply statistical analysis in the field of intelligent manufacturing. For more information, please follow other related articles on the PHP Chinese website!

Hot AI Tools

Undresser.AI Undress
AI-powered app for creating realistic nude photos

AI Clothes Remover
Online AI tool for removing clothes from photos.

Undress AI Tool
Undress images for free

Clothoff.io
AI clothes remover

Video Face Swap
Swap faces in any video effortlessly with our completely free AI face swap tool!

Hot Article
Hot Tools

Notepad++7.3.1
Easy-to-use and free code editor

SublimeText3 Chinese version
Chinese version, very easy to use

Zend Studio 13.0.1
Powerful PHP integrated development environment

Dreamweaver CS6
Visual web development tools

SublimeText3 Mac version
God-level code editing software (SublimeText3)
Hot Topics


 Java Spring Interview Questions
Aug 30, 2024 pm 04:29 PM
Java Spring Interview Questions
Aug 30, 2024 pm 04:29 PM
In this article, we have kept the most asked Java Spring Interview Questions with their detailed answers. So that you can crack the interview.
 Break or return from Java 8 stream forEach?
Feb 07, 2025 pm 12:09 PM
Break or return from Java 8 stream forEach?
Feb 07, 2025 pm 12:09 PM
Java 8 introduces the Stream API, providing a powerful and expressive way to process data collections. However, a common question when using Stream is: How to break or return from a forEach operation? Traditional loops allow for early interruption or return, but Stream's forEach method does not directly support this method. This article will explain the reasons and explore alternative methods for implementing premature termination in Stream processing systems. Further reading: Java Stream API improvements Understand Stream forEach The forEach method is a terminal operation that performs one operation on each element in the Stream. Its design intention is
 TimeStamp to Date in Java
Aug 30, 2024 pm 04:28 PM
TimeStamp to Date in Java
Aug 30, 2024 pm 04:28 PM
Guide to TimeStamp to Date in Java. Here we also discuss the introduction and how to convert timestamp to date in java along with examples.
 PHP: A Key Language for Web Development
Apr 13, 2025 am 12:08 AM
PHP: A Key Language for Web Development
Apr 13, 2025 am 12:08 AM
PHP is a scripting language widely used on the server side, especially suitable for web development. 1.PHP can embed HTML, process HTTP requests and responses, and supports a variety of databases. 2.PHP is used to generate dynamic web content, process form data, access databases, etc., with strong community support and open source resources. 3. PHP is an interpreted language, and the execution process includes lexical analysis, grammatical analysis, compilation and execution. 4.PHP can be combined with MySQL for advanced applications such as user registration systems. 5. When debugging PHP, you can use functions such as error_reporting() and var_dump(). 6. Optimize PHP code to use caching mechanisms, optimize database queries and use built-in functions. 7
 Java Program to Find the Volume of Capsule
Feb 07, 2025 am 11:37 AM
Java Program to Find the Volume of Capsule
Feb 07, 2025 am 11:37 AM
Capsules are three-dimensional geometric figures, composed of a cylinder and a hemisphere at both ends. The volume of the capsule can be calculated by adding the volume of the cylinder and the volume of the hemisphere at both ends. This tutorial will discuss how to calculate the volume of a given capsule in Java using different methods. Capsule volume formula The formula for capsule volume is as follows: Capsule volume = Cylindrical volume Volume Two hemisphere volume in, r: The radius of the hemisphere. h: The height of the cylinder (excluding the hemisphere). Example 1 enter Radius = 5 units Height = 10 units Output Volume = 1570.8 cubic units explain Calculate volume using formula: Volume = π × r2 × h (4
 PHP vs. Python: Understanding the Differences
Apr 11, 2025 am 12:15 AM
PHP vs. Python: Understanding the Differences
Apr 11, 2025 am 12:15 AM
PHP and Python each have their own advantages, and the choice should be based on project requirements. 1.PHP is suitable for web development, with simple syntax and high execution efficiency. 2. Python is suitable for data science and machine learning, with concise syntax and rich libraries.
 Create the Future: Java Programming for Absolute Beginners
Oct 13, 2024 pm 01:32 PM
Create the Future: Java Programming for Absolute Beginners
Oct 13, 2024 pm 01:32 PM
Java is a popular programming language that can be learned by both beginners and experienced developers. This tutorial starts with basic concepts and progresses through advanced topics. After installing the Java Development Kit, you can practice programming by creating a simple "Hello, World!" program. After you understand the code, use the command prompt to compile and run the program, and "Hello, World!" will be output on the console. Learning Java starts your programming journey, and as your mastery deepens, you can create more complex applications.
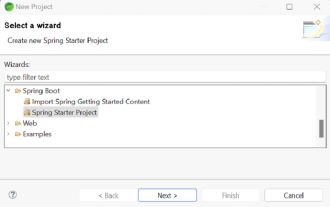 How to Run Your First Spring Boot Application in Spring Tool Suite?
Feb 07, 2025 pm 12:11 PM
How to Run Your First Spring Boot Application in Spring Tool Suite?
Feb 07, 2025 pm 12:11 PM
Spring Boot simplifies the creation of robust, scalable, and production-ready Java applications, revolutionizing Java development. Its "convention over configuration" approach, inherent to the Spring ecosystem, minimizes manual setup, allo
