

How to create a cumulative curve graph in Python?

otive graphs graphically represent the cumulative distribution function (CDF) of a set of data, sometimes called a cumulative frequency curve. It is used to examine data distribution and discover patterns and trends. Matplotlib, Pandas, and Numpy are some of the libraries and tools provided by Python for creating otive graphics. In this tutorial, we will look at how to use Matplotlib to generate ogive graphics in Python.
To create a cumulative curve chart, we need to import the required libraries. In this example we will use Matplotlib, Pandas and Numpy. Matplotlib is a popular data visualization library for creating interactive charts and graphs in Python. Numpy, on the other hand, is used to perform complex mathematical operations. Pandas is another widely used Python library specialized for data manipulation and analysis.
grammar
plt.plot(*np.histogram(data, bins), 'o-')
In this syntax, 'data' is the data set used to create the cumulative curve chart. The frequency distribution of the data is determined by the 'np.histogram' function, which also returns the histogram's values and bin boundaries. Use 'plt.plot' to create a cumulative curve plot, using the ' 'o-' ' format string to plot the data points and connect them with lines. The '*' operator then passes the histogram values and bin bounds as separate arguments to 'plt.plot'.
Example
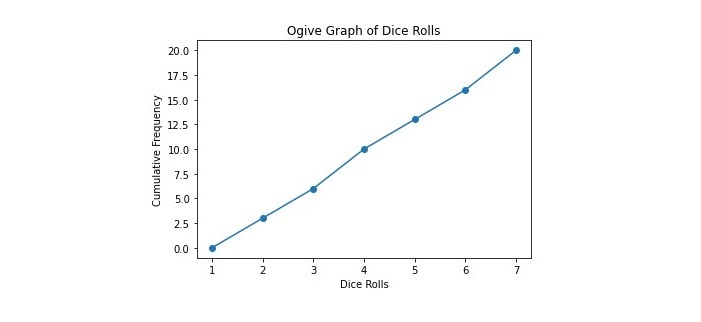
This is a simple example that creates an ogive plot to visualize the cumulative frequency distribution of a list of dice throws.
import numpy as np
import matplotlib.pyplot as plt

# List of dice rolls
rolls = [1, 2, 3, 4, 5, 6, 3, 6, 2, 5, 1, 6, 4, 2, 3, 5, 1, 4, 6, 3]

# Calculate the cumulative frequency
bins = np.arange(0, 8, 1)
freq, bins = np.histogram(rolls, bins=bins)
cumulative_freq = np.cumsum(freq)

# Create the ogive graph
plt.plot(bins[1:], cumulative_freq, '-o')
plt.xlabel('Dice Rolls')
plt.ylabel('Cumulative Frequency')
plt.title('Ogive Graph of Dice Rolls')
plt.show()
First, we created an ogive plot to visualize the cumulative frequency distribution of a set of dice throw results, by importing the necessary modules NumPy and Matplotlib. Then, the code defines a set of dice rolling results and uses NumPy's histogram function to generate a "histogram" of the data, specifying the number of groups and value range of the data. Next, use NumPy’s ‘cumsum’ function to represent the cumulative frequency of the data.
Finally, use Matplotlib's "plot" function to plot the cumulative frequencies as a logarithmic plot, with the upper limit of each bin used as the x-axis, forming an ogive plot. The resulting ogive plot shows the cumulative frequency distribution of dice throws, where the x-axis represents the values rolled and the y-axis represents the cumulative frequency of those values up to a certain point. This graph can be used to analyze the frequency and distribution of dice throws.
Output
Example
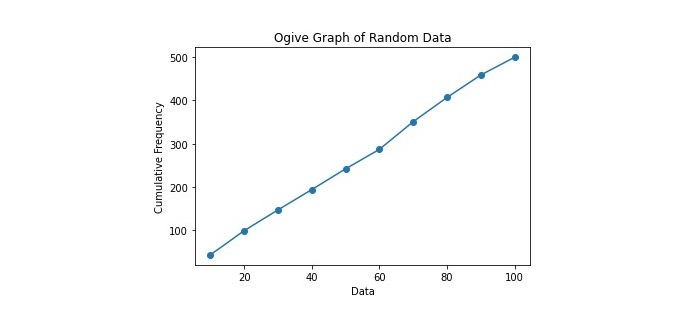
This example demonstrates an ogive plot for visualizing the distribution of 500 random numbers between 0 and 100.
import numpy as np
import matplotlib.pyplot as plt

# Generate random data
data = np.random.randint(0, 100, 500)

# Calculate the cumulative frequency
bins = np.arange(0, 110, 10)
freq, bins = np.histogram(data, bins=bins)
cumulative_freq = np.cumsum(freq)

# Create the ogive graph
plt.plot(bins[1:], cumulative_freq, '-o')
plt.xlabel('Data')
plt.ylabel('Cumulative Frequency')
plt.title('Ogive Graph of Random Data')
plt.show()
In this example, we first use NumPy to generate a data set containing 500 random numbers between 0 and 100. Then use NumPy to calculate the cumulative frequency of the data, and the interval width of each frequency is 10. Finally, use Matplotlib to plot the relationship between the cumulative frequency and the upper limit of each interval to generate an ogive plot. This example demonstrates how to create an ogive plot using Python and randomly generated data.
Output
We learned to use the Matplotlib module to create cumulative curve plots in Python, which is a simple process using the matplotlib library. By loading your data, calculating cumulative frequencies, and plotting the results, you can easily visualize the distribution of your data set and identify any patterns or trends. You can customize your graphics with labels, titles, and styles to make them more visually appealing and informative. Cumulative line graphs are useful tools in statistical analysis and can represent a variety of data, from income distributions to test scores.
The above is the detailed content of How to create a cumulative curve graph in Python?. For more information, please follow other related articles on the PHP Chinese website!

Hot AI Tools

Undresser.AI Undress
AI-powered app for creating realistic nude photos

AI Clothes Remover
Online AI tool for removing clothes from photos.

Undress AI Tool
Undress images for free

Clothoff.io
AI clothes remover

Video Face Swap
Swap faces in any video effortlessly with our completely free AI face swap tool!

Hot Article
Hot Tools

Notepad++7.3.1
Easy-to-use and free code editor

SublimeText3 Chinese version
Chinese version, very easy to use

Zend Studio 13.0.1
Powerful PHP integrated development environment

Dreamweaver CS6
Visual web development tools

SublimeText3 Mac version
God-level code editing software (SublimeText3)
Hot Topics
 1655
1655
 14
1413
52
1306
25
1252
29
1226
24
14
1413
52
1306
25
1252
29
1226
24

 PHP and Python: Different Paradigms Explained
Apr 18, 2025 am 12:26 AM
PHP and Python: Different Paradigms Explained
Apr 18, 2025 am 12:26 AM
PHP is mainly procedural programming, but also supports object-oriented programming (OOP); Python supports a variety of paradigms, including OOP, functional and procedural programming. PHP is suitable for web development, and Python is suitable for a variety of applications such as data analysis and machine learning.
 Choosing Between PHP and Python: A Guide
Apr 18, 2025 am 12:24 AM
Choosing Between PHP and Python: A Guide
Apr 18, 2025 am 12:24 AM
PHP is suitable for web development and rapid prototyping, and Python is suitable for data science and machine learning. 1.PHP is used for dynamic web development, with simple syntax and suitable for rapid development. 2. Python has concise syntax, is suitable for multiple fields, and has a strong library ecosystem.
 PHP and Python: A Deep Dive into Their History
Apr 18, 2025 am 12:25 AM
PHP and Python: A Deep Dive into Their History
Apr 18, 2025 am 12:25 AM
PHP originated in 1994 and was developed by RasmusLerdorf. It was originally used to track website visitors and gradually evolved into a server-side scripting language and was widely used in web development. Python was developed by Guidovan Rossum in the late 1980s and was first released in 1991. It emphasizes code readability and simplicity, and is suitable for scientific computing, data analysis and other fields.
 Python vs. JavaScript: The Learning Curve and Ease of Use
Apr 16, 2025 am 12:12 AM
Python vs. JavaScript: The Learning Curve and Ease of Use
Apr 16, 2025 am 12:12 AM
Python is more suitable for beginners, with a smooth learning curve and concise syntax; JavaScript is suitable for front-end development, with a steep learning curve and flexible syntax. 1. Python syntax is intuitive and suitable for data science and back-end development. 2. JavaScript is flexible and widely used in front-end and server-side programming.
 How to run sublime code python
Apr 16, 2025 am 08:48 AM
How to run sublime code python
Apr 16, 2025 am 08:48 AM
To run Python code in Sublime Text, you need to install the Python plug-in first, then create a .py file and write the code, and finally press Ctrl B to run the code, and the output will be displayed in the console.
 Where to write code in vscode
Apr 15, 2025 pm 09:54 PM
Where to write code in vscode
Apr 15, 2025 pm 09:54 PM
Writing code in Visual Studio Code (VSCode) is simple and easy to use. Just install VSCode, create a project, select a language, create a file, write code, save and run it. The advantages of VSCode include cross-platform, free and open source, powerful features, rich extensions, and lightweight and fast.
 Can vs code run in Windows 8
Apr 15, 2025 pm 07:24 PM
Can vs code run in Windows 8
Apr 15, 2025 pm 07:24 PM
VS Code can run on Windows 8, but the experience may not be great. First make sure the system has been updated to the latest patch, then download the VS Code installation package that matches the system architecture and install it as prompted. After installation, be aware that some extensions may be incompatible with Windows 8 and need to look for alternative extensions or use newer Windows systems in a virtual machine. Install the necessary extensions to check whether they work properly. Although VS Code is feasible on Windows 8, it is recommended to upgrade to a newer Windows system for a better development experience and security.
 How to run python with notepad
Apr 16, 2025 pm 07:33 PM
How to run python with notepad
Apr 16, 2025 pm 07:33 PM
Running Python code in Notepad requires the Python executable and NppExec plug-in to be installed. After installing Python and adding PATH to it, configure the command "python" and the parameter "{CURRENT_DIRECTORY}{FILE_NAME}" in the NppExec plug-in to run Python code in Notepad through the shortcut key "F6".
