
 Backend Development
Python Tutorial
How to use dendrogram to implement visual clustering in Python
Backend Development
Python Tutorial
How to use dendrogram to implement visual clustering in Python
How to use dendrogram to implement visual clustering in Python

Dendogram
A dendrogram is a diagram that shows hierarchical relationships between objects, groups, or variables. A dendrogram consists of branches connected at nodes or clusters that represent groups of observations with similar characteristics. The height of a branch or the distance between nodes indicates how different or similar the groups are. That is, the longer the branches or the greater the distance between nodes, the less similar the groups are. The shorter the branches or the smaller the distance between nodes, the more similar the groups are.
Dendograms are useful for visualizing complex data structures and identifying subgroups or clusters of data with similar characteristics. They are commonly used in biology, genetics, ecology, social sciences, and other fields where data can be grouped based on similarity or correlation.
Background knowledge:
The word "dendrogram" comes from the Greek words "dendron" (tree) and "gramma" (drawing). In 1901, British mathematician and statistician Karl Pearson used a tree diagram to show the relationship between different plant species [1]. He called this graph a "cluster graph." This can be considered the first use of dendrograms.
Data preparation
We will use the real stock prices of several companies for clustering. For easy access, data is collected using the free API provided by Alpha Vantage. Alpha Vantage provides both free API and premium API. Access through the API requires a key, please refer to his website.
import pandasaspd
import requests

 companies={'Apple':'AAPL','Amazon':'AMZN','Facebook':'META','Tesla':'TSLA','Alphabet (Google)':'GOOGL','Shell':'SHEL','Suncor Energy':'SU',
            'Exxon Mobil Corp':'XOM','Lululemon':'LULU','Walmart':'WMT','Carters':'CRI','Childrens Place':'PLCE','TJX Companies':'TJX',
'Victorias Secret':'VSCO','MACYs':'M','Wayfair':'W','Dollar Tree':'DLTR','CVS Caremark':'CVS','Walgreen':'WBA','Curaleaf':'CURLF'}Twenty companies were selected from technology, retail, oil and gas and other industries.
import time
all_data={}
forkey,valueincompanies.items():
# Replace YOUR_API_KEY with your Alpha Vantage API key
url=f'https://www.alphavantage.co/query?function=TIME_SERIES_DAILY_ADJUSTED&symbol={value}&apikey=<YOUR_API_KEY>&outputsize=full'
response=requests.get(url)
data=response.json()
time.sleep(15)
if'Time Series (Daily)'indataanddata['Time Series (Daily)']:
df=pd.DataFrame.from_dict(data['Time Series (Daily)'], orient='index')
print(f'Received data for {key}')
else:
print("Time series data is empty or not available.")
df.rename(columns= {'1. open':key}, inplace=True)
all_data[key]=df[key]The above code sets a 15-second pause between API calls to ensure that it will not be blocked too frequently.
# find common dates among all data frames
 common_dates=None
 fordf_key, dfinall_data.items():
     ifcommon_datesisNone:
         common_dates=set(df.index)
     else:
         common_dates=common_dates.intersection(df.index)

 common_dates=sorted(list(common_dates))

 # create new data frame with common dates as index
 df_combined=pd.DataFrame(index=common_dates)

 # reindex each data frame with common dates and concatenate horizontally
 fordf_key, dfinall_data.items():
df_combined=pd.concat([df_combined, df.reindex(common_dates)], axis=1)Integrate the above data into the DF we need, which can be used directly below
Hierarchical clustering
Hierarchical clustering is a kind of application Clustering algorithms for machine learning and data analysis. It uses a hierarchy of nested clusters to group similar objects into clusters based on similarity. The algorithm can be either agglomerative, which starts with single objects and merges them into clusters, or divisive, which starts with a large cluster and recursively divides it into smaller clusters.
It should be noted that not all clustering methods are hierarchical clustering methods, and dendrograms can only be used on a few clustering algorithms.
Clustering Algorithm We will use hierarchical clustering provided in scipy module.
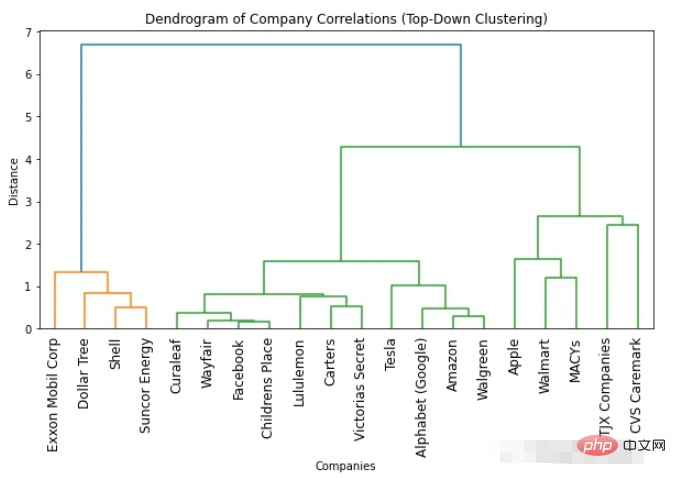
1. Top-down clustering
import numpyasnp
import scipy.cluster.hierarchyassch
import matplotlib.pyplotasplt

 # Convert correlation matrix to distance matrix
 dist_mat=1-df_combined.corr()

 # Perform top-down clustering
 clustering=sch.linkage(dist_mat, method='complete')
 cuts=sch.cut_tree(clustering, n_clusters=[3, 4])

 # Plot dendrogram
 plt.figure(figsize=(10, 5))
 sch.dendrogram(clustering, labels=list(df_combined.columns), leaf_rotation=90)
 plt.title('Dendrogram of Company Correlations (Top-Down Clustering)')
 plt.xlabel('Companies')
 plt.ylabel('Distance')
 plt.show()
##How to determine the optimal number of clusters based on the dendrogram
The easiest way to find the optimal number of clusters is to look at the number of colors used in the resulting dendrogram. The optimal number of clusters is one less than the number of colors. So according to the dendrogram above, the optimal number of clusters is two. Another way to find the optimal number of clusters is to identify points where the distance between clusters suddenly changes. This is called the "inflection point" or "elbow point" and can be used to determine the number of clusters that best captures the variation in the data. We can see in the above figure that the maximum distance change between different numbers of clusters occurs between 1 and 2 clusters. So again, the optimal number of clusters is two.Get any number of clusters from the dendrogram
One advantage of using a dendrogram is that you can cluster objects into any number of clusters by looking at the dendrogram in clusters. For example, if you need to find two clusters, you can look at the top vertical line on the dendrogram and decide on the clusters. For example, in this example, if two clusters are required, then there are four companies in the first cluster and 16 companies in the second cluster. If we need three clusters we can further split the second cluster into 11 and 5 companies. If you need more, you can follow this example.2. Bottom-up clustering
import numpyasnp
import scipy.cluster.hierarchyassch
import matplotlib.pyplotasplt

 # Convert correlation matrix to distance matrix
 dist_mat=1-df_combined.corr()

 # Perform bottom-up clustering
 clustering=sch.linkage(dist_mat, method='ward')

 # Plot dendrogram
 plt.figure(figsize=(10, 5))
 sch.dendrogram(clustering, labels=list(df_combined.columns), leaf_rotation=90)
 plt.title('Dendrogram of Company Correlations (Bottom-Up Clustering)')
 plt.xlabel('Companies')
 plt.ylabel('Distance')
 plt.show()
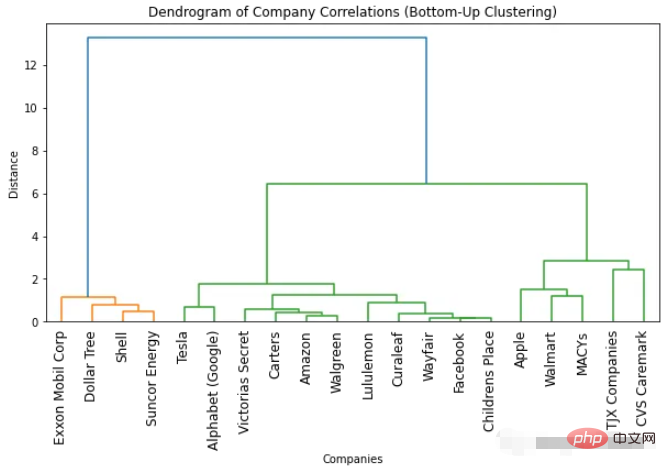 ##The dendrogram we obtained for bottom-up clustering Similar to top-down clustering. The optimal number of clusters is still two (based on the number of colors and the "inflection point" method). But if we require more clusters, some subtle differences will be observed. This is normal because the methods used are different, resulting in slight differences in the results.
The above is the detailed content of How to use dendrogram to implement visual clustering in Python. For more information, please follow other related articles on the PHP Chinese website!

Hot AI Tools

Undresser.AI Undress
AI-powered app for creating realistic nude photos

AI Clothes Remover
Online AI tool for removing clothes from photos.

Undress AI Tool
Undress images for free

Clothoff.io
AI clothes remover

Video Face Swap
Swap faces in any video effortlessly with our completely free AI face swap tool!

Hot Article
Hot Tools

Notepad++7.3.1
Easy-to-use and free code editor

SublimeText3 Chinese version
Chinese version, very easy to use

Zend Studio 13.0.1
Powerful PHP integrated development environment

Dreamweaver CS6
Visual web development tools

SublimeText3 Mac version
God-level code editing software (SublimeText3)
Hot Topics
 1653
1653
 14
1413
52
1306
25
1251
29
1224
24
14
1413
52
1306
25
1251
29
1224
24

 PHP and Python: Different Paradigms Explained
Apr 18, 2025 am 12:26 AM
PHP and Python: Different Paradigms Explained
Apr 18, 2025 am 12:26 AM
PHP is mainly procedural programming, but also supports object-oriented programming (OOP); Python supports a variety of paradigms, including OOP, functional and procedural programming. PHP is suitable for web development, and Python is suitable for a variety of applications such as data analysis and machine learning.
 Choosing Between PHP and Python: A Guide
Apr 18, 2025 am 12:24 AM
Choosing Between PHP and Python: A Guide
Apr 18, 2025 am 12:24 AM
PHP is suitable for web development and rapid prototyping, and Python is suitable for data science and machine learning. 1.PHP is used for dynamic web development, with simple syntax and suitable for rapid development. 2. Python has concise syntax, is suitable for multiple fields, and has a strong library ecosystem.
 PHP and Python: A Deep Dive into Their History
Apr 18, 2025 am 12:25 AM
PHP and Python: A Deep Dive into Their History
Apr 18, 2025 am 12:25 AM
PHP originated in 1994 and was developed by RasmusLerdorf. It was originally used to track website visitors and gradually evolved into a server-side scripting language and was widely used in web development. Python was developed by Guidovan Rossum in the late 1980s and was first released in 1991. It emphasizes code readability and simplicity, and is suitable for scientific computing, data analysis and other fields.
 Python vs. JavaScript: The Learning Curve and Ease of Use
Apr 16, 2025 am 12:12 AM
Python vs. JavaScript: The Learning Curve and Ease of Use
Apr 16, 2025 am 12:12 AM
Python is more suitable for beginners, with a smooth learning curve and concise syntax; JavaScript is suitable for front-end development, with a steep learning curve and flexible syntax. 1. Python syntax is intuitive and suitable for data science and back-end development. 2. JavaScript is flexible and widely used in front-end and server-side programming.
 How to run sublime code python
Apr 16, 2025 am 08:48 AM
How to run sublime code python
Apr 16, 2025 am 08:48 AM
To run Python code in Sublime Text, you need to install the Python plug-in first, then create a .py file and write the code, and finally press Ctrl B to run the code, and the output will be displayed in the console.
 Can vs code run in Windows 8
Apr 15, 2025 pm 07:24 PM
Can vs code run in Windows 8
Apr 15, 2025 pm 07:24 PM
VS Code can run on Windows 8, but the experience may not be great. First make sure the system has been updated to the latest patch, then download the VS Code installation package that matches the system architecture and install it as prompted. After installation, be aware that some extensions may be incompatible with Windows 8 and need to look for alternative extensions or use newer Windows systems in a virtual machine. Install the necessary extensions to check whether they work properly. Although VS Code is feasible on Windows 8, it is recommended to upgrade to a newer Windows system for a better development experience and security.
 Where to write code in vscode
Apr 15, 2025 pm 09:54 PM
Where to write code in vscode
Apr 15, 2025 pm 09:54 PM
Writing code in Visual Studio Code (VSCode) is simple and easy to use. Just install VSCode, create a project, select a language, create a file, write code, save and run it. The advantages of VSCode include cross-platform, free and open source, powerful features, rich extensions, and lightweight and fast.
 How to run python with notepad
Apr 16, 2025 pm 07:33 PM
How to run python with notepad
Apr 16, 2025 pm 07:33 PM
Running Python code in Notepad requires the Python executable and NppExec plug-in to be installed. After installing Python and adding PATH to it, configure the command "python" and the parameter "{CURRENT_DIRECTORY}{FILE_NAME}" in the NppExec plug-in to run Python code in Notepad through the shortcut key "F6".
