

Deep ensemble learning algorithm for retinal image classification

Translator | Zhu Xianzhong
Revised | Sun Shujuan

Picture 1 : Cover of the Iluminado project designed by the original author himself
In 2019, the World Health Organization estimated that there were approximately 2.2 billion people with visual impairments in the world, of which at least 1 billion could have been prevented or are still suffering from visual impairments. treat. When it comes to eye care, the world faces many challenges, including inequalities in coverage and quality of preventive, therapeutic and rehabilitative services. There is a lack of trained eye care staff and eye care services are poorly integrated into the main health system. My goal is to inspire action to address these challenges together. The project presented in this article is part of Iluminado, my current data science capstone project.
The design goals of the Capstone project
The purpose of creating this project is to train a deep learning ensemble model, and ultimately implement the model very easily for low-income families available, and initial disease risk diagnosis can be performed at low cost. By using my model procedure, ophthalmologists can determine whether immediate intervention is needed based on retinal fundus photography.
Project data set source
OphthAI provides a fundus multi-disease image data set (Retinal Fundus Multi-Disease Image Dataset, referred to as "RFMiD") Publicly available image dataset, this dataset contains 3200 fundus images captured by three different fundus cameras and annotated by two senior retinal experts based on adjudicated consensus.
These images were extracted from thousands of inspections performed during 2009-2010, selecting both high-quality images and quite a few low-quality images to make Data sets are more challenging.
The data set is divided into three parts, including training set (60% or 1920 images), evaluation set (20% or 640 images) and test set (20% and 640 photos). On average, the proportions of people with diseases in the training set, evaluation set, and test set were 60±7%, 20±7%, and 20±5%, respectively. The basic purpose of this dataset is to address various eye diseases that arise in daily clinical practice, with a total of 45 categories of diseases/pathologies identified. These labels can be found in three CSV files, namely RFMiD_Training_Labels.CSV, RFMiD_Validation_Labels.SSV and RFMiD_Testing_Labels.CSV.
Image source
The image below was taken using a tool called a fundus camera. A fundus camera is a specialized low-power microscope attached to a flash camera that is used to photograph the fundus, the retinal layer at the back of the eye.
Nowadays, most fundus cameras are handheld, so the patient only has to look directly into the lens. Among them, the bright flash part indicates that the fundus image has been taken.
Handheld cameras have their advantages as they can be carried to different locations and can accommodate patients with special needs, such as wheelchair users. Additionally, any employee with the required training can operate the camera, allowing underserved diabetic patients to have their annual check-ups quickly, safely and efficiently.
Fundus retinal imaging system photography situation:
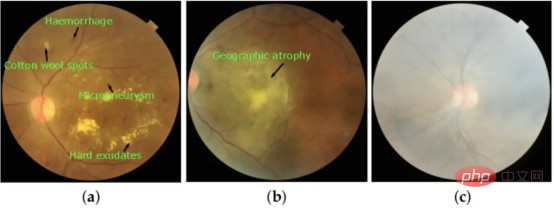
Figure 2: Images taken based on respective visual characteristics : (a) diabetic retinopathy (DR), (b) age-related macular degeneration (ARMD) and (c) moderate haze (MH).
Where is the final diagnosis done?
The initial screening process can be assisted by deep learning, but the final diagnosis is made by an ophthalmologist using slit lamp examination.
This process, also known as biomicroscopic diagnosis, involves the examination of living cells. The doctor can perform a microscopic examination to determine if there are any abnormalities in the patient's eyes.

Figure 3: Illustration of slit lamp examination
Application of deep learning in retinal image classification
Different from traditional machine learning algorithms, depth Convolutional neural networks (CNN) can use multi-layer models to automatically extract and classify features from raw data.
Recently, a large number of academic articles have been published on the use of convolutional neural networks (CNN) to identify various eye diseases, such as diabetic retinopathy and abnormal outcomes (AUROC) >0.9) glaucoma, etc.
Data Metrics
The AUROC score summarizes the ROC curve into a number that describes how well the model performs when handling multiple thresholds simultaneously. It is worth noting that an AUROC score of 1 represents a perfect score, while an AUROC score of 0.5 corresponds to random guessing.
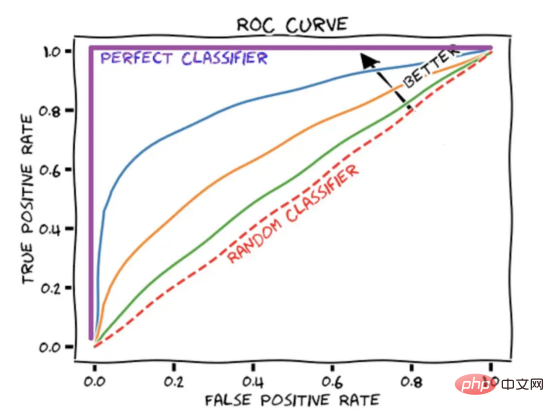
Figure 4: Schematic diagram of ROC curve display
Method used - cross entropy loss function
Cross entropy is often used as a loss function in machine learning. Cross entropy is a metric in the field of information theory that builds on the definition of entropy and is typically used to calculate the difference between two probability distributions, while cross entropy can be thought of as calculating the total entropy between two distributions.
Cross entropy is also related to logistic loss, called logarithmic loss. Although these two measures come from different sources, when used as a loss function for a classification model, both methods calculate the same quantity and can be used interchangeably.
(For specific details, please refer to: https://machinelearningmastery.com/logistic-regression-with-maximum-likelihood-estimation/)
What is cross-entropy?
Cross entropy is a measure of the difference between two probability distributions given a random variable or set of events. You may recall that information quantifies the number of bits required to encode and transmit an event. Low-probability events tend to contain more information, while high-probability events contain less information.
In information theory, we like to describe the "surprise" of events. The less likely an event is to occur, the more surprising it is, which means it contains more information.
- Low Probability Event (Surprising): More information.
- High probability event (no surprise): less information.
Given the probability of event P(x), the information h(x) can be calculated for event x, as follows:
h(x) = -log(P(x))
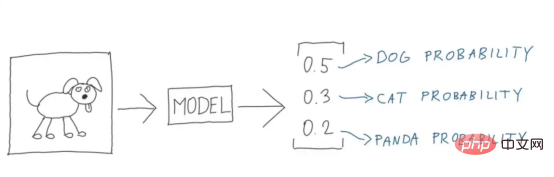
Figure 4: Perfect illustration (Image source: Vlastimil Martinek)
Entropy is the transmission of randomness from a probability distribution The number of bits required for the selected event. Skewed distributions have lower entropy, while distributions with equal probabilities of events generally have higher entropy.
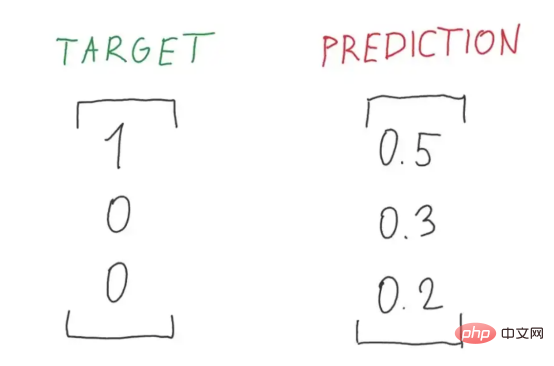
Figure 5: A perfect illustration of the ratio of target to predicted probability (Image source: Vlastimil Martinek)
Skewed probability distributions have fewer "surprises" and in turn have lower entropy because possible events dominate. Relatively speaking, the equilibrium distribution is more surprising and has higher entropy because the events are equally likely to occur.
- Skewed probability distribution (no surprise): low entropy.
- Balanced probability distribution (surprisingly): high entropy.
Entropy H(x) can be calculated for a random variable with a set x of x discrete states and its probability P(x), as shown in the following figure:
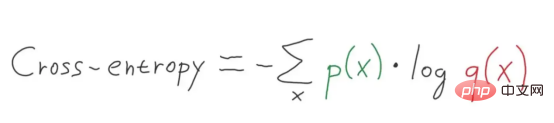
Figure 6: Multi-level cross-entropy formula (Image source: Vlastimil Martinek)
Multi-category classification - we use multiple Categorical cross-entropy is a specific application case of cross-entropy where the target uses a one-hot encoding vector scheme. (Interested readers can refer to Vlastimil Martinek’s article)
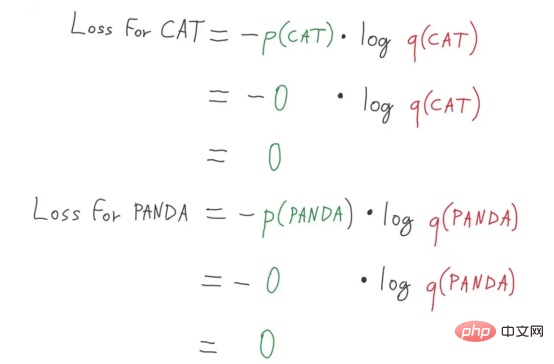
Figure 7: Perfect decomposition diagram of panda and cat loss calculation (Image source: Vlastimil Martinek)
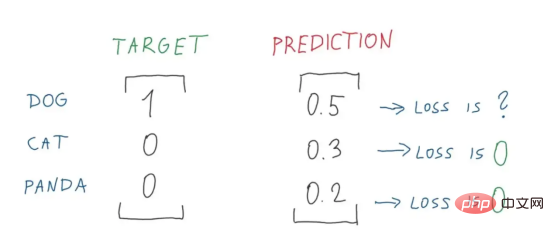
Figure 8: Perfect decomposition of loss value Figure 1 (Image source: Vlastimil Martinek)
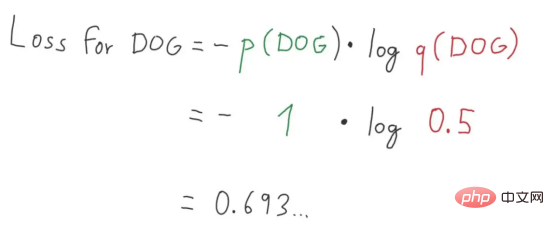
Figure 9: Perfect decomposition of loss value Figure 2 (Image source: Vlastimil Martinek)
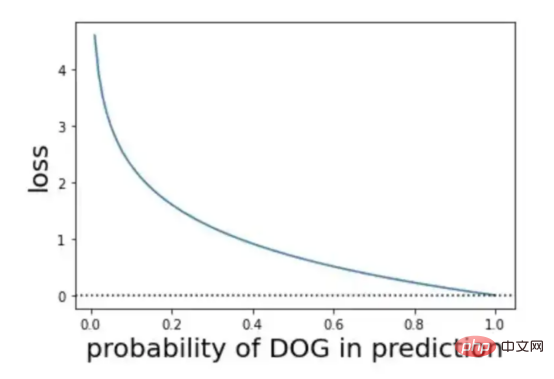
Figure 9: Visual representation on probability and loss (Image source: Vlastimil Martinek)
What about binary cross-entropy?
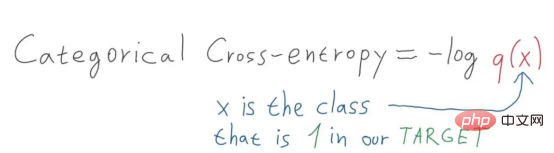
Figure 10: Illustration of the categorical cross-entropy formula (Image source: Vlastimil Martinek)
In our project We chose to use binary classification - a binary cross-entropy scheme, that is, a cross-entropy scheme with a target of 0 or 1. If we convert the targets into hot encoding vectors of [0,1] or [1,0] respectively and predict, then we can use the cross-entropy formula to calculate.
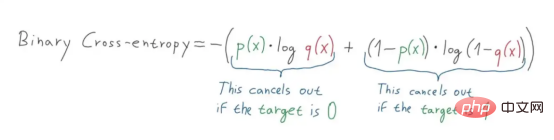
Figure 11: Illustration of the binary cross entropy calculation formula (Image source: Vlastimil Martinek)
Use asymmetry Loss algorithm handles imbalanced data
In a typical multi-label model environment, the features of the data set may have a disproportionate number of positive and negative labels. At this point, the tendency of the data set to favor negative labels has a dominant impact on the optimization process and ultimately leads to under-emphasis of the gradients of positive labels, thereby reducing the accuracy of the prediction results.
This is exactly the situation faced by the data set I currently choose.
This project uses the asymmetric loss algorithm developed by BenBaruch and others (refer to Figure 12). This is a method to solve multi-label classification, but there are also serious problems in the categories. Unbalanced distribution situation.
The way I think of it is: by asymmetrically modifying the positive and negative components of the cross entropy, thereby reducing the weight of the negative label part, and finally highlighting the above-mentioned positive labels that are more difficult to process. part weight.
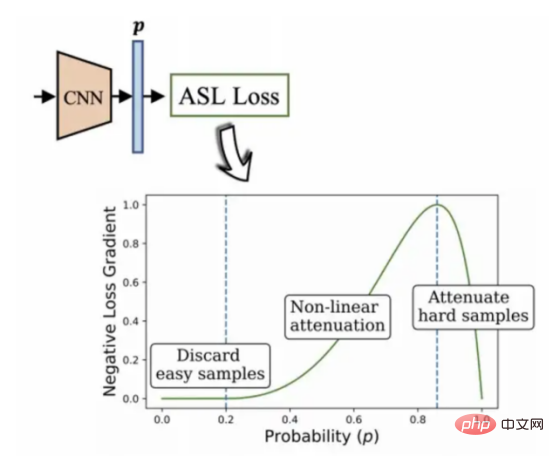
Figure 12: Asymmetric multi-label classification algorithm (2020, author: Ben-Baruch et al.)
To be Tested architecture
To summarize, the project in this article uses the architecture shown in the figure:
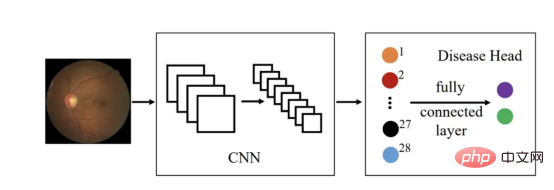
## Figure 13 (Picture source: Sixu)
The key algorithms used in the above architecture mainly include:
- DenseNet-121
- InceptionV3
- Xception
- MobileNetV2
- VGG16
In addition, the above-mentioned algorithm-related content will definitely be updated after I complete the Capstone project of this article! Interested readers please stay tuned!
Translator Introduction
Zhu Xianzhong, 51CTO community editor, 51CTO expert blogger, lecturer, computer teacher at a university in Weifang, and a veteran in the freelance programming industry.
Original title: ##Deep Ensemble Learning for Retinal Image Classification (CNN) By Cathy Kam
The above is the detailed content of Deep ensemble learning algorithm for retinal image classification. For more information, please follow other related articles on the PHP Chinese website!

Hot AI Tools

Undresser.AI Undress
AI-powered app for creating realistic nude photos

AI Clothes Remover
Online AI tool for removing clothes from photos.

Undress AI Tool
Undress images for free

Clothoff.io
AI clothes remover

Video Face Swap
Swap faces in any video effortlessly with our completely free AI face swap tool!

Hot Article
Hot Tools

Notepad++7.3.1
Easy-to-use and free code editor

SublimeText3 Chinese version
Chinese version, very easy to use

Zend Studio 13.0.1
Powerful PHP integrated development environment

Dreamweaver CS6
Visual web development tools

SublimeText3 Mac version
God-level code editing software (SublimeText3)
Hot Topics


 Methods and steps for using BERT for sentiment analysis in Python
Jan 22, 2024 pm 04:24 PM
Methods and steps for using BERT for sentiment analysis in Python
Jan 22, 2024 pm 04:24 PM
BERT is a pre-trained deep learning language model proposed by Google in 2018. The full name is BidirectionalEncoderRepresentationsfromTransformers, which is based on the Transformer architecture and has the characteristics of bidirectional encoding. Compared with traditional one-way coding models, BERT can consider contextual information at the same time when processing text, so it performs well in natural language processing tasks. Its bidirectionality enables BERT to better understand the semantic relationships in sentences, thereby improving the expressive ability of the model. Through pre-training and fine-tuning methods, BERT can be used for various natural language processing tasks, such as sentiment analysis, naming
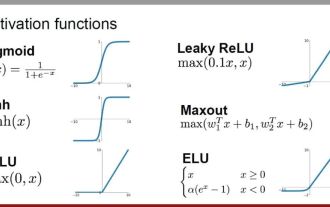 Analysis of commonly used AI activation functions: deep learning practice of Sigmoid, Tanh, ReLU and Softmax
Dec 28, 2023 pm 11:35 PM
Analysis of commonly used AI activation functions: deep learning practice of Sigmoid, Tanh, ReLU and Softmax
Dec 28, 2023 pm 11:35 PM
Activation functions play a crucial role in deep learning. They can introduce nonlinear characteristics into neural networks, allowing the network to better learn and simulate complex input-output relationships. The correct selection and use of activation functions has an important impact on the performance and training results of neural networks. This article will introduce four commonly used activation functions: Sigmoid, Tanh, ReLU and Softmax, starting from the introduction, usage scenarios, advantages, disadvantages and optimization solutions. Dimensions are discussed to provide you with a comprehensive understanding of activation functions. 1. Sigmoid function Introduction to SIgmoid function formula: The Sigmoid function is a commonly used nonlinear function that can map any real number to between 0 and 1. It is usually used to unify the
 Latent space embedding: explanation and demonstration
Jan 22, 2024 pm 05:30 PM
Latent space embedding: explanation and demonstration
Jan 22, 2024 pm 05:30 PM
Latent Space Embedding (LatentSpaceEmbedding) is the process of mapping high-dimensional data to low-dimensional space. In the field of machine learning and deep learning, latent space embedding is usually a neural network model that maps high-dimensional input data into a set of low-dimensional vector representations. This set of vectors is often called "latent vectors" or "latent encodings". The purpose of latent space embedding is to capture important features in the data and represent them into a more concise and understandable form. Through latent space embedding, we can perform operations such as visualizing, classifying, and clustering data in low-dimensional space to better understand and utilize the data. Latent space embedding has wide applications in many fields, such as image generation, feature extraction, dimensionality reduction, etc. Latent space embedding is the main
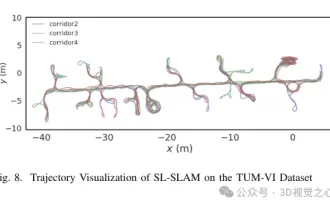 Beyond ORB-SLAM3! SL-SLAM: Low light, severe jitter and weak texture scenes are all handled
May 30, 2024 am 09:35 AM
Beyond ORB-SLAM3! SL-SLAM: Low light, severe jitter and weak texture scenes are all handled
May 30, 2024 am 09:35 AM
Written previously, today we discuss how deep learning technology can improve the performance of vision-based SLAM (simultaneous localization and mapping) in complex environments. By combining deep feature extraction and depth matching methods, here we introduce a versatile hybrid visual SLAM system designed to improve adaptation in challenging scenarios such as low-light conditions, dynamic lighting, weakly textured areas, and severe jitter. sex. Our system supports multiple modes, including extended monocular, stereo, monocular-inertial, and stereo-inertial configurations. In addition, it also analyzes how to combine visual SLAM with deep learning methods to inspire other research. Through extensive experiments on public datasets and self-sampled data, we demonstrate the superiority of SL-SLAM in terms of positioning accuracy and tracking robustness.
 From basics to practice, review the development history of Elasticsearch vector retrieval
Oct 23, 2023 pm 05:17 PM
From basics to practice, review the development history of Elasticsearch vector retrieval
Oct 23, 2023 pm 05:17 PM
1. Introduction Vector retrieval has become a core component of modern search and recommendation systems. It enables efficient query matching and recommendations by converting complex objects (such as text, images, or sounds) into numerical vectors and performing similarity searches in multidimensional spaces. From basics to practice, review the development history of Elasticsearch vector retrieval_elasticsearch As a popular open source search engine, Elasticsearch's development in vector retrieval has always attracted much attention. This article will review the development history of Elasticsearch vector retrieval, focusing on the characteristics and progress of each stage. Taking history as a guide, it is convenient for everyone to establish a full range of Elasticsearch vector retrieval.
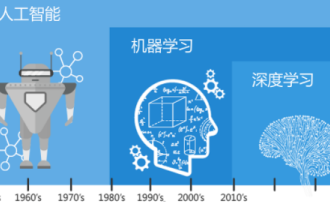 Understand in one article: the connections and differences between AI, machine learning and deep learning
Mar 02, 2024 am 11:19 AM
Understand in one article: the connections and differences between AI, machine learning and deep learning
Mar 02, 2024 am 11:19 AM
In today's wave of rapid technological changes, Artificial Intelligence (AI), Machine Learning (ML) and Deep Learning (DL) are like bright stars, leading the new wave of information technology. These three words frequently appear in various cutting-edge discussions and practical applications, but for many explorers who are new to this field, their specific meanings and their internal connections may still be shrouded in mystery. So let's take a look at this picture first. It can be seen that there is a close correlation and progressive relationship between deep learning, machine learning and artificial intelligence. Deep learning is a specific field of machine learning, and machine learning
 Super strong! Top 10 deep learning algorithms!
Mar 15, 2024 pm 03:46 PM
Super strong! Top 10 deep learning algorithms!
Mar 15, 2024 pm 03:46 PM
Almost 20 years have passed since the concept of deep learning was proposed in 2006. Deep learning, as a revolution in the field of artificial intelligence, has spawned many influential algorithms. So, what do you think are the top 10 algorithms for deep learning? The following are the top algorithms for deep learning in my opinion. They all occupy an important position in terms of innovation, application value and influence. 1. Deep neural network (DNN) background: Deep neural network (DNN), also called multi-layer perceptron, is the most common deep learning algorithm. When it was first invented, it was questioned due to the computing power bottleneck. Until recent years, computing power, The breakthrough came with the explosion of data. DNN is a neural network model that contains multiple hidden layers. In this model, each layer passes input to the next layer and
 AlphaFold 3 is launched, comprehensively predicting the interactions and structures of proteins and all living molecules, with far greater accuracy than ever before
Jul 16, 2024 am 12:08 AM
AlphaFold 3 is launched, comprehensively predicting the interactions and structures of proteins and all living molecules, with far greater accuracy than ever before
Jul 16, 2024 am 12:08 AM
Editor | Radish Skin Since the release of the powerful AlphaFold2 in 2021, scientists have been using protein structure prediction models to map various protein structures within cells, discover drugs, and draw a "cosmic map" of every known protein interaction. . Just now, Google DeepMind released the AlphaFold3 model, which can perform joint structure predictions for complexes including proteins, nucleic acids, small molecules, ions and modified residues. The accuracy of AlphaFold3 has been significantly improved compared to many dedicated tools in the past (protein-ligand interaction, protein-nucleic acid interaction, antibody-antigen prediction). This shows that within a single unified deep learning framework, it is possible to achieve
