

Draw some interesting visualization charts in Python


Flowcharts exist in every aspect of our lives. They are of great help to us in tracking the progress of projects and making decisions on various things. As for the almighty Python, Drawing flow charts is also very easy. Today I will introduce to you two modules for drawing flow charts. Let’s look at the first one first.
SchemDraw
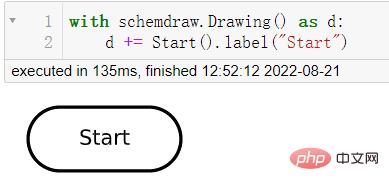
So in the SchemDraw module, there are six elements used to represent the main nodes of the flow chart. The ovals represent the beginning and end of the decision. , the code is as follows:
import schemdraw
from schemdraw.flow import *
with schemdraw.Drawing() as d:
d += Start().label("Start")output
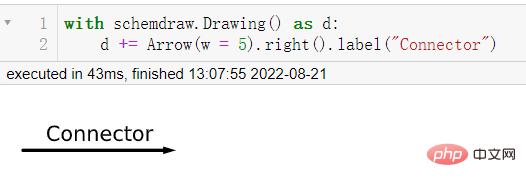
The arrow represents the direction of decision-making and is used to connect each node. The code is as follows:
with schemdraw.Drawing() as d:
d += Arrow(w = 5).right().label("Connector")output
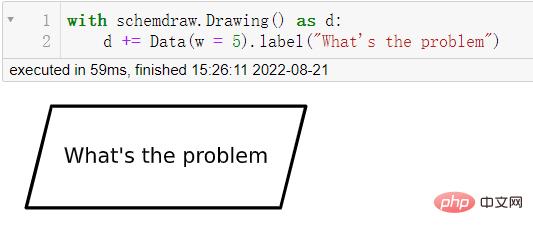
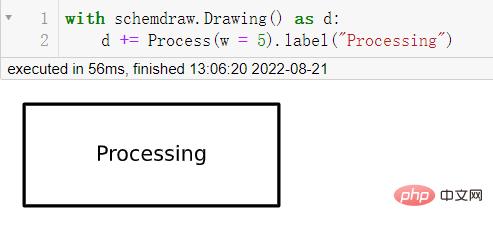
The parallelogram represents the problem you have to deal with and solve, and the rectangle represents the effort you have to make for it. The effort or process, the code is as follows:
with schemdraw.Drawing() as d:
d += Data(w = 5).label("What's the problem")output
##
with schemdraw.Drawing() as d:
 d += Process(w = 5).label("Processing")
with schemdraw.Drawing() as d:
 d += Decision(w = 5).label("Decisions")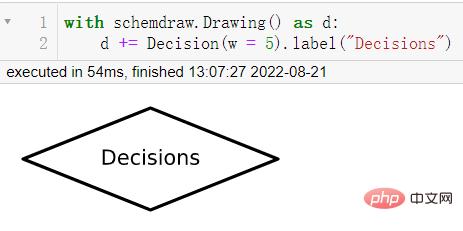
import schemdraw
from schemdraw.flow import *
with schemdraw.Drawing() as d:
 d+= Start().label("Start")
 d+= Arrow().down(d.unit/2)
 # 具体是啥问题嘞
 d+= Data(w = 4).label("Go camping or not")
 d+= Arrow().down(d.unit/2)
 # 第一步 查看天气
 d+= Box(w = 4).label("Check weather first")
 d+= Arrow().down(d.unit/2)
 # 是否是晴天
 d+= (decision := Decision(w = 5, h= 5,
S = "True",
 E = "False").label("See if it's sunny"))
 # 如果是真的话
 d+= Arrow().length(d.unit/2)
 d+= (true := Box(w = 5).label("Sunny, go camping"))
 d+= Arrow().length(d.unit/2)
 # 结束
 d+= (end := Ellipse().label("End"))
 # 如果不是晴天的话
 d+= Arrow().right(d.unit).at(decision.E)
 # 那如果是下雨天的话,就不能去露营咯
 d+= (false := Box(w = 5).label("Rainy, stay at home"))
 # 决策的走向
 d+= Arrow().down(d.unit*2.5).at(false.S)
 # 决策的走向
 d+= Arrow().left(d.unit*2.15)
 d.save("palindrome flowchart.jpeg", dpi = 300)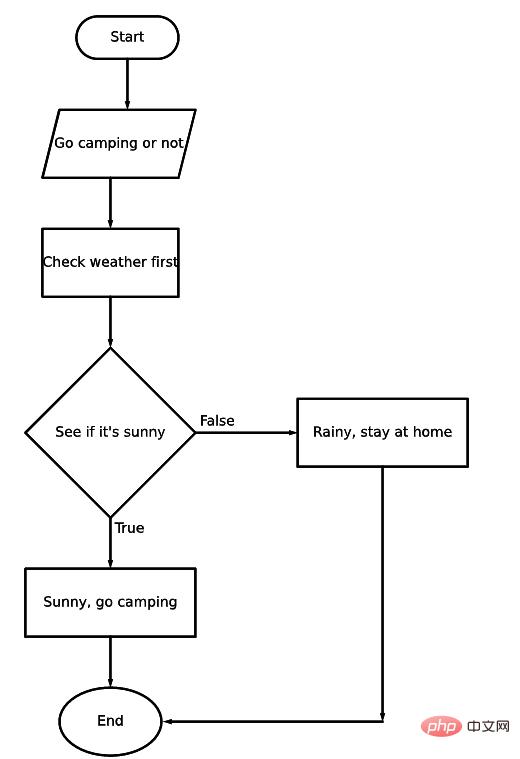
import networkx as nx
import matplotlib.pyplot as plt
import numpy as np
G = nx.DiGraph()
nodes = np.arange(0, 8).tolist()
G.add_nodes_from(nodes)
# 节点连接的信息,哪些节点的是相连接的
G.add_edges_from([(0,1), (0,2),
(1,3), (1, 4),
(2, 5), (2, 6), (2,7)])
# 节点的位置
pos = {0:(10, 10),
1:(7.5, 7.5), 2:(12.5, 7.5),
3:(6, 6), 4:(9, 6),
5:(11, 6), 6:(14, 6), 7:(17, 6)}
# 节点的标记
labels = {0:"CEO",
 1: "Team A Lead",
 2: "Team B Lead",
 3: "Staff A",
 4: "Staff B",
 5: "Staff C",
 6: "Staff D",
 7: "Staff E"}
nx.draw_networkx(G, pos = pos, labels = labels, arrows = True,
node_shape = "s", node_color = "white")
plt.title("Company Structure")
plt.show()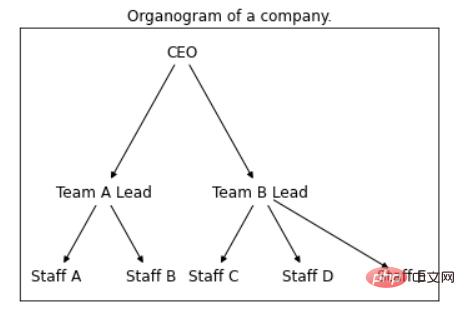
nx.draw_networkx(G, pos = pos, labels = labels,
bbox = dict(facecolor = "skyblue",
boxstyle = "round", ec = "silver", pad = 0.3),
edge_color = "gray"
 )
plt.title("Company Structure")
plt.show()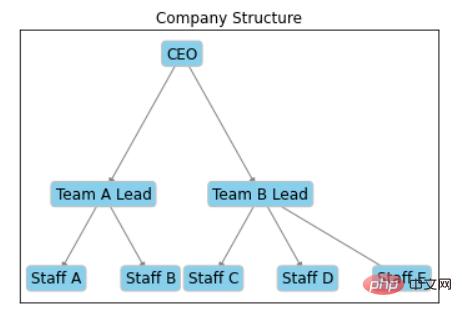
The above is the detailed content of Draw some interesting visualization charts in Python. For more information, please follow other related articles on the PHP Chinese website!

Hot AI Tools

Undresser.AI Undress
AI-powered app for creating realistic nude photos

AI Clothes Remover
Online AI tool for removing clothes from photos.

Undress AI Tool
Undress images for free

Clothoff.io
AI clothes remover

Video Face Swap
Swap faces in any video effortlessly with our completely free AI face swap tool!

Hot Article
Hot Tools

Notepad++7.3.1
Easy-to-use and free code editor

SublimeText3 Chinese version
Chinese version, very easy to use

Zend Studio 13.0.1
Powerful PHP integrated development environment

Dreamweaver CS6
Visual web development tools

SublimeText3 Mac version
God-level code editing software (SublimeText3)
Hot Topics
 1677
1677
 14
1431
52
1334
25
1280
29
1257
24
14
1431
52
1334
25
1280
29
1257
24

 PHP and Python: Different Paradigms Explained
Apr 18, 2025 am 12:26 AM
PHP and Python: Different Paradigms Explained
Apr 18, 2025 am 12:26 AM
PHP is mainly procedural programming, but also supports object-oriented programming (OOP); Python supports a variety of paradigms, including OOP, functional and procedural programming. PHP is suitable for web development, and Python is suitable for a variety of applications such as data analysis and machine learning.
 Choosing Between PHP and Python: A Guide
Apr 18, 2025 am 12:24 AM
Choosing Between PHP and Python: A Guide
Apr 18, 2025 am 12:24 AM
PHP is suitable for web development and rapid prototyping, and Python is suitable for data science and machine learning. 1.PHP is used for dynamic web development, with simple syntax and suitable for rapid development. 2. Python has concise syntax, is suitable for multiple fields, and has a strong library ecosystem.
 How to run sublime code python
Apr 16, 2025 am 08:48 AM
How to run sublime code python
Apr 16, 2025 am 08:48 AM
To run Python code in Sublime Text, you need to install the Python plug-in first, then create a .py file and write the code, and finally press Ctrl B to run the code, and the output will be displayed in the console.
 PHP and Python: A Deep Dive into Their History
Apr 18, 2025 am 12:25 AM
PHP and Python: A Deep Dive into Their History
Apr 18, 2025 am 12:25 AM
PHP originated in 1994 and was developed by RasmusLerdorf. It was originally used to track website visitors and gradually evolved into a server-side scripting language and was widely used in web development. Python was developed by Guidovan Rossum in the late 1980s and was first released in 1991. It emphasizes code readability and simplicity, and is suitable for scientific computing, data analysis and other fields.
 Golang vs. Python: Performance and Scalability
Apr 19, 2025 am 12:18 AM
Golang vs. Python: Performance and Scalability
Apr 19, 2025 am 12:18 AM
Golang is better than Python in terms of performance and scalability. 1) Golang's compilation-type characteristics and efficient concurrency model make it perform well in high concurrency scenarios. 2) Python, as an interpreted language, executes slowly, but can optimize performance through tools such as Cython.
 How to run python with notepad
Apr 16, 2025 pm 07:33 PM
How to run python with notepad
Apr 16, 2025 pm 07:33 PM
Running Python code in Notepad requires the Python executable and NppExec plug-in to be installed. After installing Python and adding PATH to it, configure the command "python" and the parameter "{CURRENT_DIRECTORY}{FILE_NAME}" in the NppExec plug-in to run Python code in Notepad through the shortcut key "F6".
 Golang vs. Python: Key Differences and Similarities
Apr 17, 2025 am 12:15 AM
Golang vs. Python: Key Differences and Similarities
Apr 17, 2025 am 12:15 AM
Golang and Python each have their own advantages: Golang is suitable for high performance and concurrent programming, while Python is suitable for data science and web development. Golang is known for its concurrency model and efficient performance, while Python is known for its concise syntax and rich library ecosystem.
 Python vs. C : Learning Curves and Ease of Use
Apr 19, 2025 am 12:20 AM
Python vs. C : Learning Curves and Ease of Use
Apr 19, 2025 am 12:20 AM
Python is easier to learn and use, while C is more powerful but complex. 1. Python syntax is concise and suitable for beginners. Dynamic typing and automatic memory management make it easy to use, but may cause runtime errors. 2.C provides low-level control and advanced features, suitable for high-performance applications, but has a high learning threshold and requires manual memory and type safety management.
