

How to debug remote gdb in vscode? Detailed explanation of method

How to debug remote gdb in vscode? The following article will introduce to you the method of remote gdb debugging of vscode. I hope it will be helpful to you!
Recently, with the guidance of a colleague, I tried using vscode for gdb debugging. After using it, it felt "really good".
Without further ado, what this article is going to achieve is: remote debugging the c code on the linux server and arm embedded device on the windows side, and sorting out the configuration and use of gdb debugging.
1. Remote connection
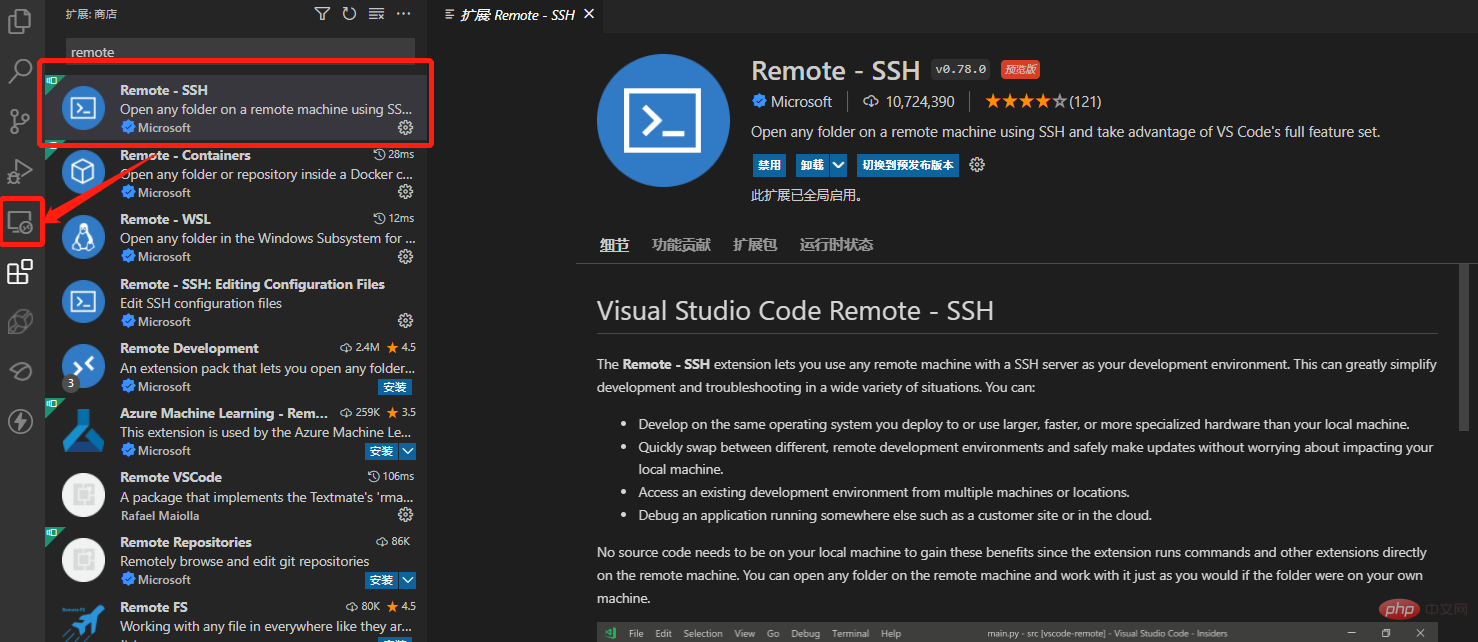
First you need to achieve remote connection to the server, search for "remote-ssh" in the plug-in library, double-click to download and install it (in the picture below I Already installed), after installation, the remote resource manager will appear in the sidebar. [Recommended learning: vscode tutorial, Programming teaching]
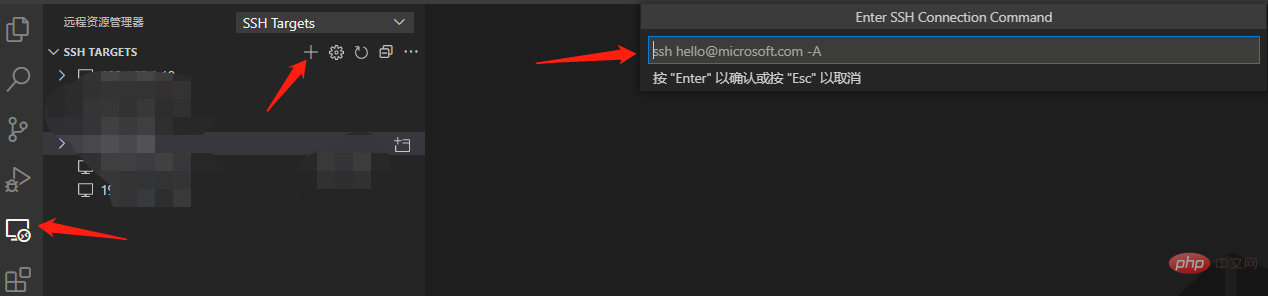
Click the + sign and enter ssh in the pop-up command window to log in command, follow the prompts, enter the password and confirm, the connection will be successful
2. Configure the GDB environment
Create on the server A c code, here is the code in "Linux C Get System User Name" as an example, it is very simple
#include <unistd.h>
#include <pwd.h>
#include <iostream>

int main()
{
	struct passwd* pwd;
	uid_t userid;
	userid = getuid();
	pwd = getpwuid(userid);

	std::cout << "pw_name:" << pwd->pw_name << std::endl;
	std::cout << "pw_passwd:" << pwd->pw_passwd << std::endl;
	std::cout << "pw_uid:" << pwd->pw_uid << std::endl;
	std::cout << "pw_gid:" << pwd->pw_gid << std::endl;
	std::cout << "pw_gecos:" << pwd->pw_gecos << std::endl;
	std::cout << "pw_dir:" << pwd->pw_dir << std::endl;
	std::cout << "pw_shell:" << pwd->pw_shell << std::endl;

    return 0;
}The compilation method is as follows, be sure to add the -g command, otherwise Unable to debug with gdb
g++ -g test.cpp -o test
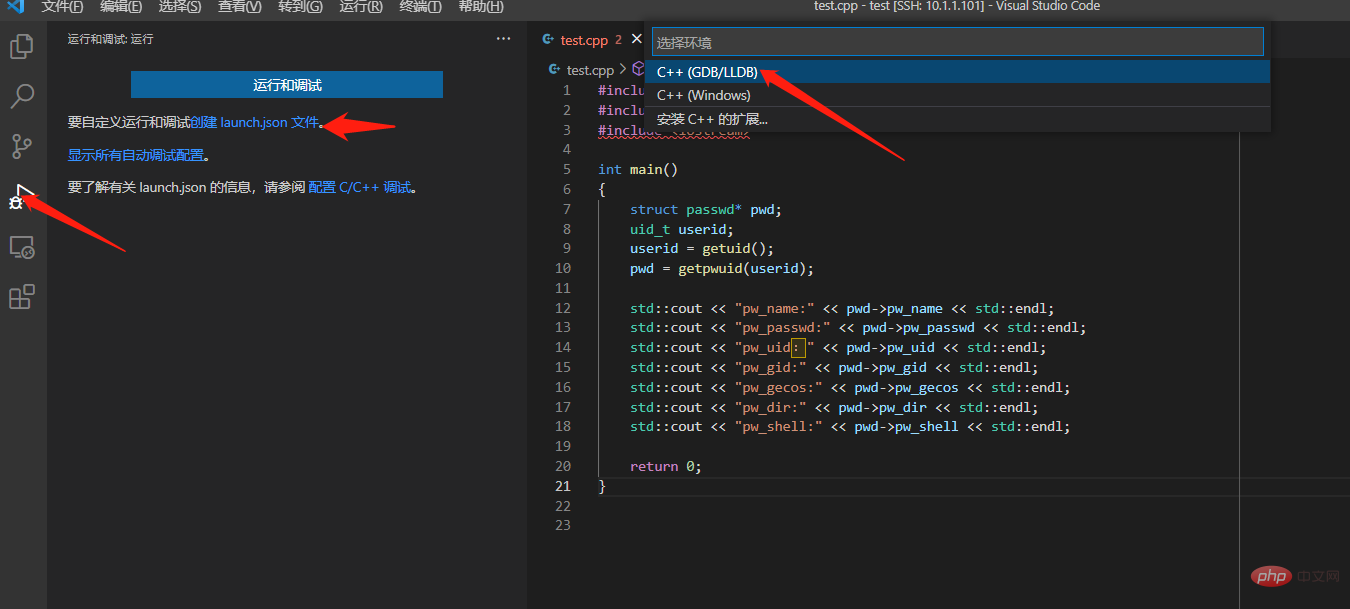
Then click File-Open Folder and find the created code path. After confirmation, you can see the code file in the resource manager on the left.
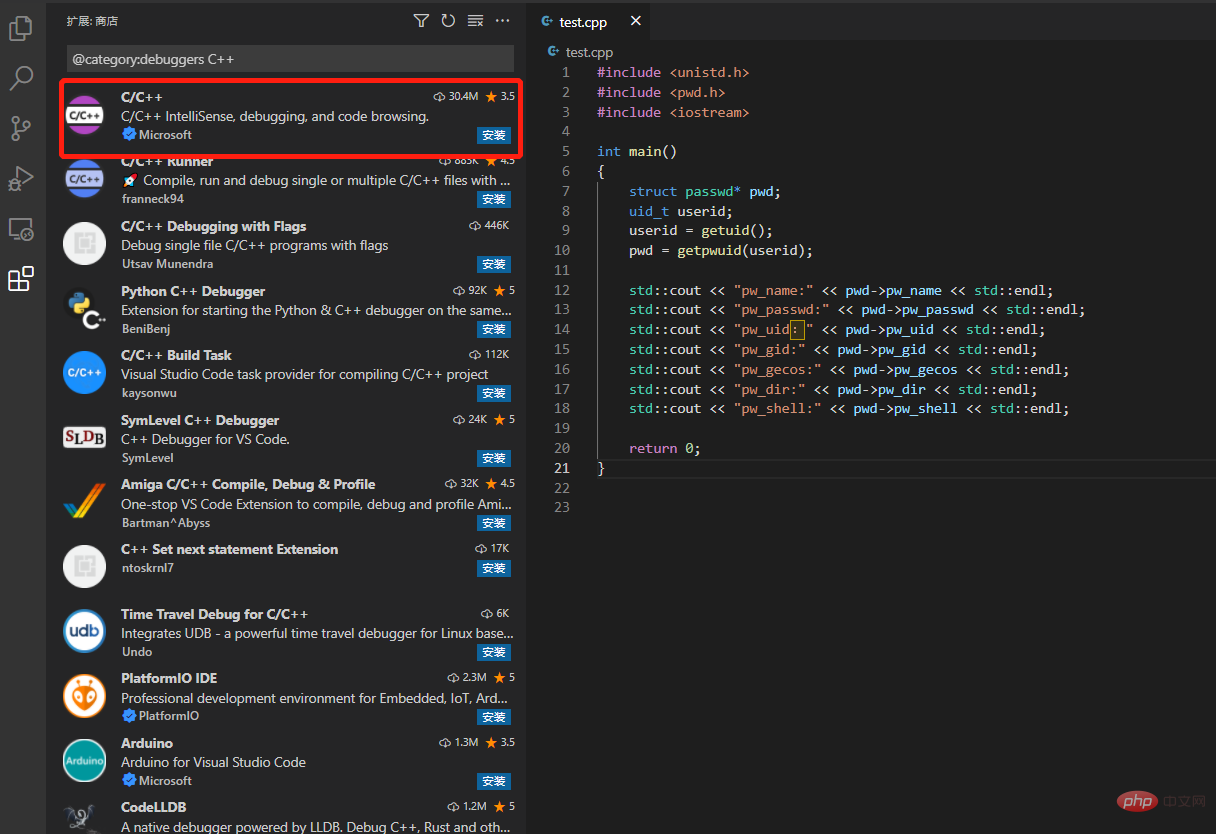
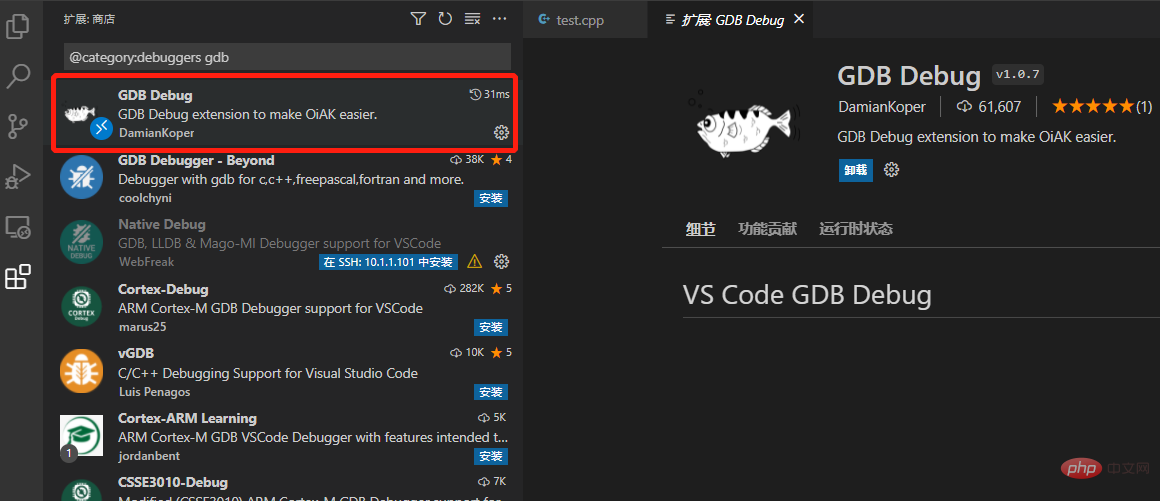
You need to install the c extension for the first run. In the extension page, install C/C
{
    // 使用 IntelliSense 了解相关属性。
    // 悬停以查看现有属性的描述。
    // 欲了解更多信息,请访问: https://go.microsoft.com/fwlink/?linkid=830387
    "version": "0.2.0",
    "configurations": []
}{
// 使用 IntelliSense 了解相关属性。
// 悬停以查看现有属性的描述。
// 欲了解更多信息,请访问: https://go.microsoft.com/fwlink/?linkid=830387
"version": "0.2.0",
"configurations": [
{
"name": "(gdb) 启动", //配置名称,显示在配置下拉菜单中
"type": "cppdbg", //配置类型
"request": "launch", //请求配置类型,可以是启动或者是附加
"program": "${workspaceFolder}/test", //程序可执行文件的完整路径,${workspaceFolder}表示远程连接的初始路径
"args": [], //传递给程序的命令行参数
"stopAtEntry": false,//可选参数,如果为true,调试程序应该在入口(main)处停止
"cwd": "${workspaceFolder}", //目标的工作目录
"environment": [], //表示要预设的环境变量
"externalConsole": false,//如果为true,则为调试对象启动控制台
"MIMode": "gdb",//要连接到的控制台启动程序
"setupCommands": [ //为了安装基础调试程序而执行的一个或多个GDB/LLDB命令
{
"description": "为 gdb 启用整齐打印",
"text": "-enable-pretty-printing",
"ignoreFailures": true
}
]
}
]
}3. GDB debugging method
In the source code, click directly to the left of the line number to add a breakpoint. After setting the breakpoint, click "Run and Debugging"--(gdb) to start, You can enter the debugging page as follows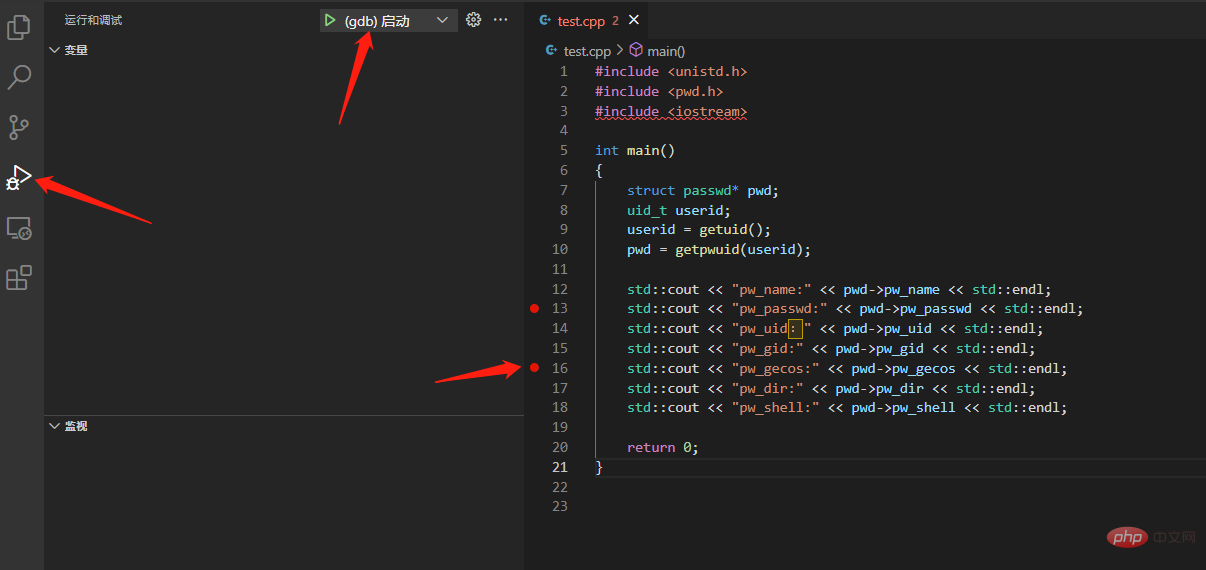
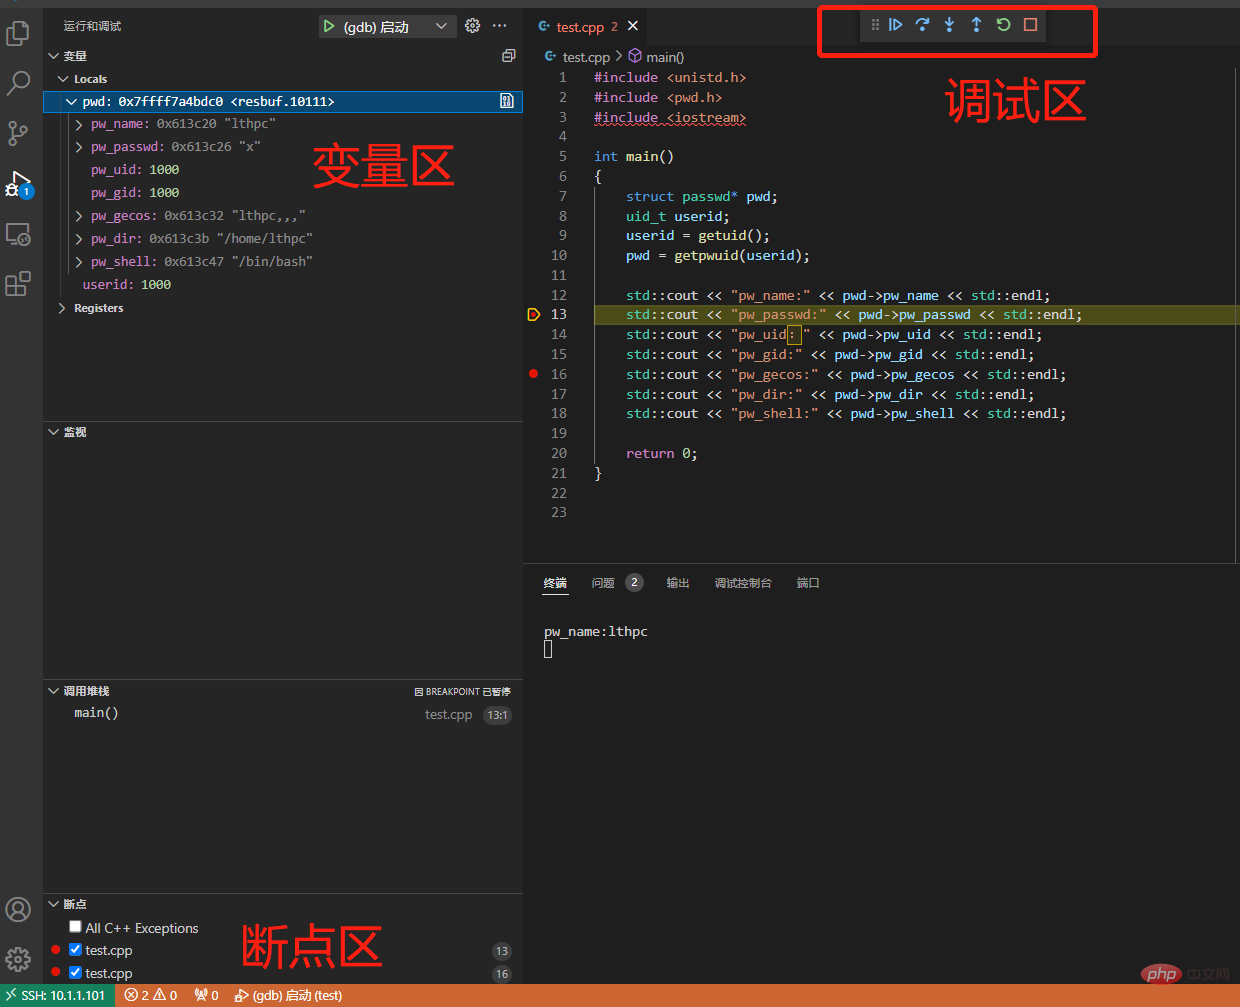
F5 Start debuggingF10 Single step skipF11 Single step debugging shift F11 Single step outctrl shift F5 Restart debuggingshift F5 Stop debugging
4. Problem summary
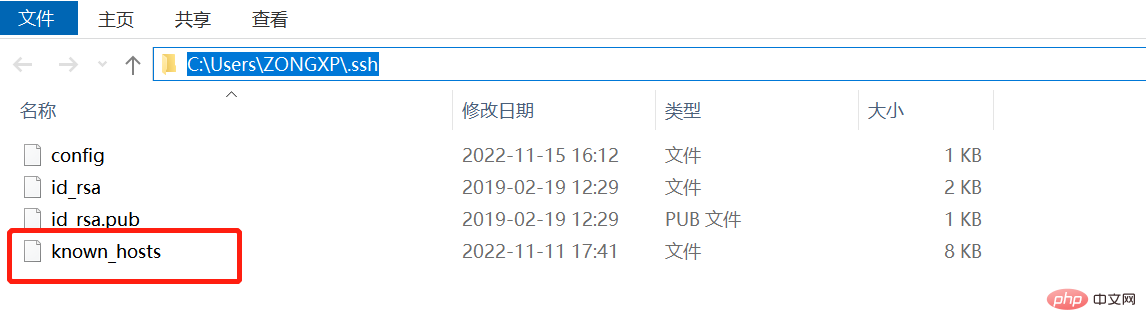
If you have connected to a certain device before, and the subsequent replacement of the device has the same IP, or the device has been reinstalled but the IP has not changed, an error will be reported when reconnecting. The reason is that the host lists the server IP as known_host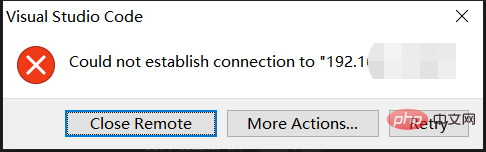
vscodeBasic Tutorial!
The above is the detailed content of How to debug remote gdb in vscode? Detailed explanation of method. For more information, please follow other related articles on the PHP Chinese website!

Hot AI Tools

Undresser.AI Undress
AI-powered app for creating realistic nude photos

AI Clothes Remover
Online AI tool for removing clothes from photos.

Undress AI Tool
Undress images for free

Clothoff.io
AI clothes remover

Video Face Swap
Swap faces in any video effortlessly with our completely free AI face swap tool!

Hot Article
Hot Tools

Notepad++7.3.1
Easy-to-use and free code editor

SublimeText3 Chinese version
Chinese version, very easy to use

Zend Studio 13.0.1
Powerful PHP integrated development environment

Dreamweaver CS6
Visual web development tools

SublimeText3 Mac version
God-level code editing software (SublimeText3)
Hot Topics


 How to define header files for vscode
Apr 15, 2025 pm 09:09 PM
How to define header files for vscode
Apr 15, 2025 pm 09:09 PM
How to define header files using Visual Studio Code? Create a header file and declare symbols in the header file using the .h or .hpp suffix name (such as classes, functions, variables) Compile the program using the #include directive to include the header file in the source file. The header file will be included and the declared symbols are available.
 What computer configuration is required for vscode
Apr 15, 2025 pm 09:48 PM
What computer configuration is required for vscode
Apr 15, 2025 pm 09:48 PM
VS Code system requirements: Operating system: Windows 10 and above, macOS 10.12 and above, Linux distribution processor: minimum 1.6 GHz, recommended 2.0 GHz and above memory: minimum 512 MB, recommended 4 GB and above storage space: minimum 250 MB, recommended 1 GB and above other requirements: stable network connection, Xorg/Wayland (Linux)
 vscode terminal usage tutorial
Apr 15, 2025 pm 10:09 PM
vscode terminal usage tutorial
Apr 15, 2025 pm 10:09 PM
vscode built-in terminal is a development tool that allows running commands and scripts within the editor to simplify the development process. How to use vscode terminal: Open the terminal with the shortcut key (Ctrl/Cmd). Enter a command or run the script. Use hotkeys (such as Ctrl L to clear the terminal). Change the working directory (such as the cd command). Advanced features include debug mode, automatic code snippet completion, and interactive command history.
 What is the difference between VS Code and Visual Studio?
Apr 05, 2025 am 12:07 AM
What is the difference between VS Code and Visual Studio?
Apr 05, 2025 am 12:07 AM
VSCode is a lightweight code editor suitable for multiple languages and extensions; VisualStudio is a powerful IDE mainly used for .NET development. 1.VSCode is based on Electron, supports cross-platform, and uses the Monaco editor. 2. VisualStudio uses Microsoft's independent technology stack to integrate debugging and compiler. 3.VSCode is suitable for simple tasks, and VisualStudio is suitable for large projects.
 Which code editor can run on Windows 7?
Apr 03, 2025 am 12:01 AM
Which code editor can run on Windows 7?
Apr 03, 2025 am 12:01 AM
Code editors that can run on Windows 7 include Notepad, SublimeText, and Atom. 1.Notepad: lightweight, fast startup, suitable for old systems. 2.SublimeText: Powerful and payable. 3.Atom: It is highly customizable, but it starts slowly.
 Can vs code run in Windows 8
Apr 15, 2025 pm 07:24 PM
Can vs code run in Windows 8
Apr 15, 2025 pm 07:24 PM
VS Code can run on Windows 8, but the experience may not be great. First make sure the system has been updated to the latest patch, then download the VS Code installation package that matches the system architecture and install it as prompted. After installation, be aware that some extensions may be incompatible with Windows 8 and need to look for alternative extensions or use newer Windows systems in a virtual machine. Install the necessary extensions to check whether they work properly. Although VS Code is feasible on Windows 8, it is recommended to upgrade to a newer Windows system for a better development experience and security.
 Visual Studio's Availability: Which Editions Are Free?
Apr 10, 2025 am 09:44 AM
Visual Studio's Availability: Which Editions Are Free?
Apr 10, 2025 am 09:44 AM
Free versions of VisualStudio include VisualStudioCommunity and VisualStudioCode. 1. VisualStudioCommunity is suitable for individual developers, open source projects and small teams. It is powerful and suitable for individual projects and learning programming. 2. VisualStudioCode is a lightweight code editor that supports multiple programming languages and extensions. It has a fast startup speed and low resource usage, making it suitable for developers who need flexibility and scalability.
 Can visual studio code be used in python
Apr 15, 2025 pm 08:18 PM
Can visual studio code be used in python
Apr 15, 2025 pm 08:18 PM
VS Code can be used to write Python and provides many features that make it an ideal tool for developing Python applications. It allows users to: install Python extensions to get functions such as code completion, syntax highlighting, and debugging. Use the debugger to track code step by step, find and fix errors. Integrate Git for version control. Use code formatting tools to maintain code consistency. Use the Linting tool to spot potential problems ahead of time.
