

Where is the linux crash log?

The Linux crash log is in "/var/log/"; the log log of "/var/log/" under Linux includes message, kernel error log demsg, etc.; the sa record records cpu, Performance files for memory and other operations; use the sa file to view the CPU and memory conditions during a crash.

#The operating environment of this tutorial: linux5.9.8 system, Dell G3 computer.
Where are the Linux crash logs?
Linux host downtime troubleshooting ideas
Cause analysis
Server classification, web server, database server, file server, middleware, Other servers.
Web server analysis: common web applications apache, nginx, IIS, etc.
There are many reasons for downtime, such as CPU, memory, IO disk, application BUG, kernel BUG, hardware, etc.
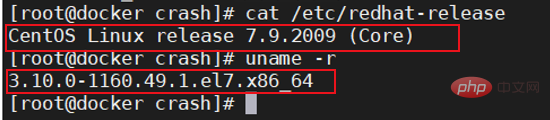
System and kernel version
Process
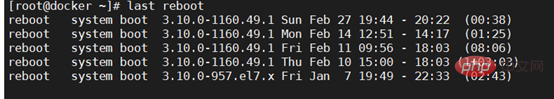
1. View the downtime time record, historical login and restart time
last reboot
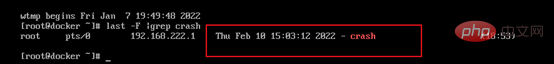
last -F | grep crash
Check the history login for any abnormal users
last

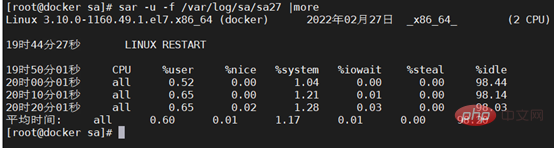
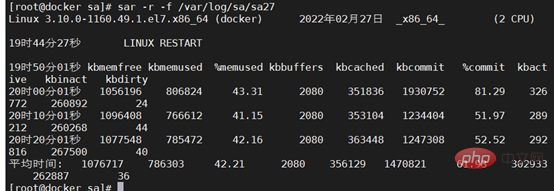
2. First Check the system log. For example, the log log under /var/log/ under Linux includes message, kernel error log demsg, etc. The sa record is a performance file that records the operation of CPU, memory, etc., and records the running status of the CPU during operation as shown in the figure. Show.
Use the sa file to check the CPU status during the crash
Use the sa file to check the memory status during the crash
The amount of logs is often very large
You can also perform fuzzy queries, such as
View error reports
tail -200 /var/log/messages |grep "Error"
cat /var/log/dmesg |grep "Error"
View kernel crash logs
tail -200 /car/log/messages |grep "crash"
Check whether When OOM occurs, the process will usually be killed by kill
cat /var/log/messages |grep -i "kill"
You can also check the logs during the downtime period, check the logs at 15:00 on December 11th
cat /vat/log/messages |grep "Feb 11 15*"
3. Check the memory usage
free -m, check the usage of swap, remaining memory and cache. If swap is used and available is not enough, you also need to check the parameter cat /proc/sys/vm/swappiness. If it is set to 0, it means there is not enough memory.

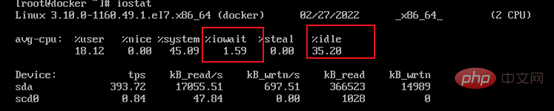
4. View io and file system using
to observe idle and iowait. The cache is used when reading and writing to the disk, which is generally 40% of the system memory. However, there is a buffering time of 120 seconds in the middle. When the cache is about to be used up, it will wait for 120 seconds before writing to the disk. When reading and writing are frequent, Sometimes it is easy to cause hanging.
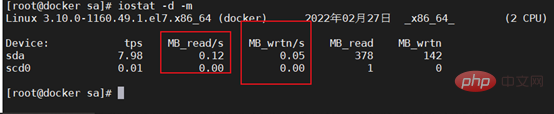
# Check the IO read and write speed. If it is very slow, it means there is a bottleneck in disk performance.
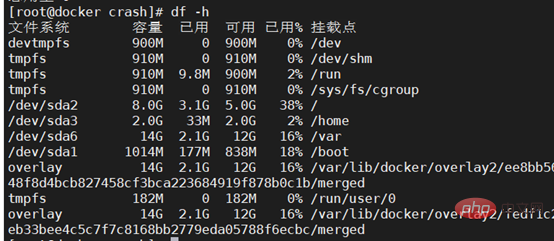
File system usage
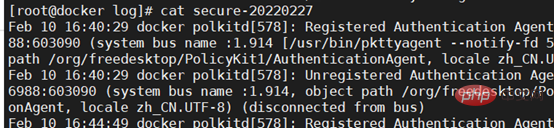
5. Check the security log
The security log is /var/ log/secure, check the history record to see if someone logged in to the host and took malicious actions, such as shutting down.
6. Use kdump and crash tools to analyze the kernel
Check that the kdump service is enabled on the server, and find the vmcore file generated that day in the /var/crash directory. Use the crash tool to analyze the vmcore file.
Kdump is used to dump memory images. It can not only dump the memory image to the local hard disk, but also dump the memory image to devices on different machines through NFS, SSH and other protocols.
Kdump is divided into two components: Kexec and Kdump.
Kexec is a quick startup tool for the kernel that allows a new kernel to be started in the context of a running kernel (production kernel) without going through time-consuming BIOS detection, making it easier for kernel developers to kernel for debugging.
Kdump is an effective memory dump tool. After enabling Kdump, the production kernel will reserve a part of the memory space for quickly booting to a new kernel through Kexec when the kernel crashes. This process does not require a restart. system so that a memory image of the crashed production kernel can be dumped.
7. Check service logs and monitoring software
If you can find the occupancy of the process during the downtime, you can check its logs based on the services with abnormal occupancy.
Service logs generally include databases and web services, middleware, frameworks, etc.
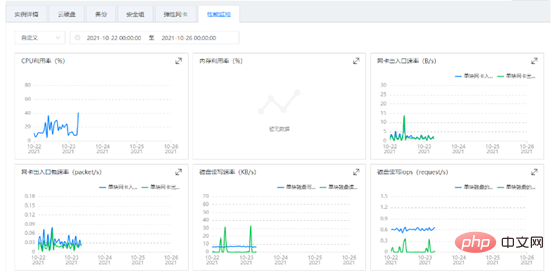
You can also view the historical record images of the monitoring software and find the image analysis of peak points and downtime points as shown below.
8. Summary
There are many reasons for system downtime, we need to carefully analyze according to the process,
Related recommendations: "Linux Video Tutorial"
The above is the detailed content of Where is the linux crash log?. For more information, please follow other related articles on the PHP Chinese website!

Hot AI Tools

Undresser.AI Undress
AI-powered app for creating realistic nude photos

AI Clothes Remover
Online AI tool for removing clothes from photos.

Undress AI Tool
Undress images for free

Clothoff.io
AI clothes remover

Video Face Swap
Swap faces in any video effortlessly with our completely free AI face swap tool!

Hot Article
Hot Tools

Notepad++7.3.1
Easy-to-use and free code editor

SublimeText3 Chinese version
Chinese version, very easy to use

Zend Studio 13.0.1
Powerful PHP integrated development environment

Dreamweaver CS6
Visual web development tools

SublimeText3 Mac version
God-level code editing software (SublimeText3)
Hot Topics


 What computer configuration is required for vscode
Apr 15, 2025 pm 09:48 PM
What computer configuration is required for vscode
Apr 15, 2025 pm 09:48 PM
VS Code system requirements: Operating system: Windows 10 and above, macOS 10.12 and above, Linux distribution processor: minimum 1.6 GHz, recommended 2.0 GHz and above memory: minimum 512 MB, recommended 4 GB and above storage space: minimum 250 MB, recommended 1 GB and above other requirements: stable network connection, Xorg/Wayland (Linux)
 Linux Architecture: Unveiling the 5 Basic Components
Apr 20, 2025 am 12:04 AM
Linux Architecture: Unveiling the 5 Basic Components
Apr 20, 2025 am 12:04 AM
The five basic components of the Linux system are: 1. Kernel, 2. System library, 3. System utilities, 4. Graphical user interface, 5. Applications. The kernel manages hardware resources, the system library provides precompiled functions, system utilities are used for system management, the GUI provides visual interaction, and applications use these components to implement functions.
 How to run java code in notepad
Apr 16, 2025 pm 07:39 PM
How to run java code in notepad
Apr 16, 2025 pm 07:39 PM
Although Notepad cannot run Java code directly, it can be achieved by using other tools: using the command line compiler (javac) to generate a bytecode file (filename.class). Use the Java interpreter (java) to interpret bytecode, execute the code, and output the result.
 vscode cannot install extension
Apr 15, 2025 pm 07:18 PM
vscode cannot install extension
Apr 15, 2025 pm 07:18 PM
The reasons for the installation of VS Code extensions may be: network instability, insufficient permissions, system compatibility issues, VS Code version is too old, antivirus software or firewall interference. By checking network connections, permissions, log files, updating VS Code, disabling security software, and restarting VS Code or computers, you can gradually troubleshoot and resolve issues.
 vscode terminal usage tutorial
Apr 15, 2025 pm 10:09 PM
vscode terminal usage tutorial
Apr 15, 2025 pm 10:09 PM
vscode built-in terminal is a development tool that allows running commands and scripts within the editor to simplify the development process. How to use vscode terminal: Open the terminal with the shortcut key (Ctrl/Cmd). Enter a command or run the script. Use hotkeys (such as Ctrl L to clear the terminal). Change the working directory (such as the cd command). Advanced features include debug mode, automatic code snippet completion, and interactive command history.
 How to check the warehouse address of git
Apr 17, 2025 pm 01:54 PM
How to check the warehouse address of git
Apr 17, 2025 pm 01:54 PM
To view the Git repository address, perform the following steps: 1. Open the command line and navigate to the repository directory; 2. Run the "git remote -v" command; 3. View the repository name in the output and its corresponding address.
 Where to write code in vscode
Apr 15, 2025 pm 09:54 PM
Where to write code in vscode
Apr 15, 2025 pm 09:54 PM
Writing code in Visual Studio Code (VSCode) is simple and easy to use. Just install VSCode, create a project, select a language, create a file, write code, save and run it. The advantages of VSCode include cross-platform, free and open source, powerful features, rich extensions, and lightweight and fast.
 Can vscode be used for mac
Apr 15, 2025 pm 07:36 PM
Can vscode be used for mac
Apr 15, 2025 pm 07:36 PM
VS Code is available on Mac. It has powerful extensions, Git integration, terminal and debugger, and also offers a wealth of setup options. However, for particularly large projects or highly professional development, VS Code may have performance or functional limitations.
