How to configure VSCode, Su Shuang's debugging Vue and React code!
How to make debugging Vue and React code more enjoyable? The following article introduces the configuration VSCode and Su Shuang’s method of debugging Vue and React code. I hope it will be helpful to everyone!

As a front-end developer, I basically have to debug Vue/React code every day. I don’t know how everyone debugs it, but I guess there are several types:
- No debugging, just look at the code to find the problem
- Console.log print log
- Use the debugger of Chrome Devtools to debug
- Use the debugger of VSCode to debug
Different debugging methods have different efficiency and experience. Now I basically use VSCode debugger to debug, which is very efficient and has a great experience. [Recommended study: "vscode introductory tutorial"]
Maybe many students still don’t know how to use VSCode to debug web pages. I will introduce it in this article.
Let’s look at React and Vue respectively:
Use VSCode to debug React code
I used create-react-app to create a demo project with such a component:
Run the development server:

The interface displayed by the browser is like this:

How to debug it with VSCode?
We add a .vscode/launch.json configuration file in the root directory:

Created a debugging configuration, the type is chrome, and specified The debugging url is the address of the development server.
Put two breakpoints in the react code:

Then click Run:

Look, XDM, it's broken! There are call stacks, current environment variables, etc.

Release the breakpoint and continue going down.
You can also get the corresponding event object when you click:

Isn’t it super convenient!
And when you are tired of writing business and want to see the react source code, just click on a certain frame in the call stack to see:
For example, the renderWithHooks method will be called during rendering. The workInProgress object inside is the current fiber node, and its memorizedState attribute is where hooks store values:

After using VSCode to debug the React code, debug the business code or look at the source code The experience is very pleasant, no matter what.
Let’s take a look at Vue:
Use VSCode to debug Vue code
Vue debugging will be more troublesome, and you need to do some additional mapping of paths based on the above.
Because in React we write jsx and tsx directly, which corresponds to the compiled js file one-to-one, but not in Vue. In Vue, we write files in SFC (single file component) format, which requires vue-loader To separate them into different files, the paths must be mapped separately to correspond to the source code location.
That is, there are more sourceMapPathOverrides in the debugging configuration:

How to map it?
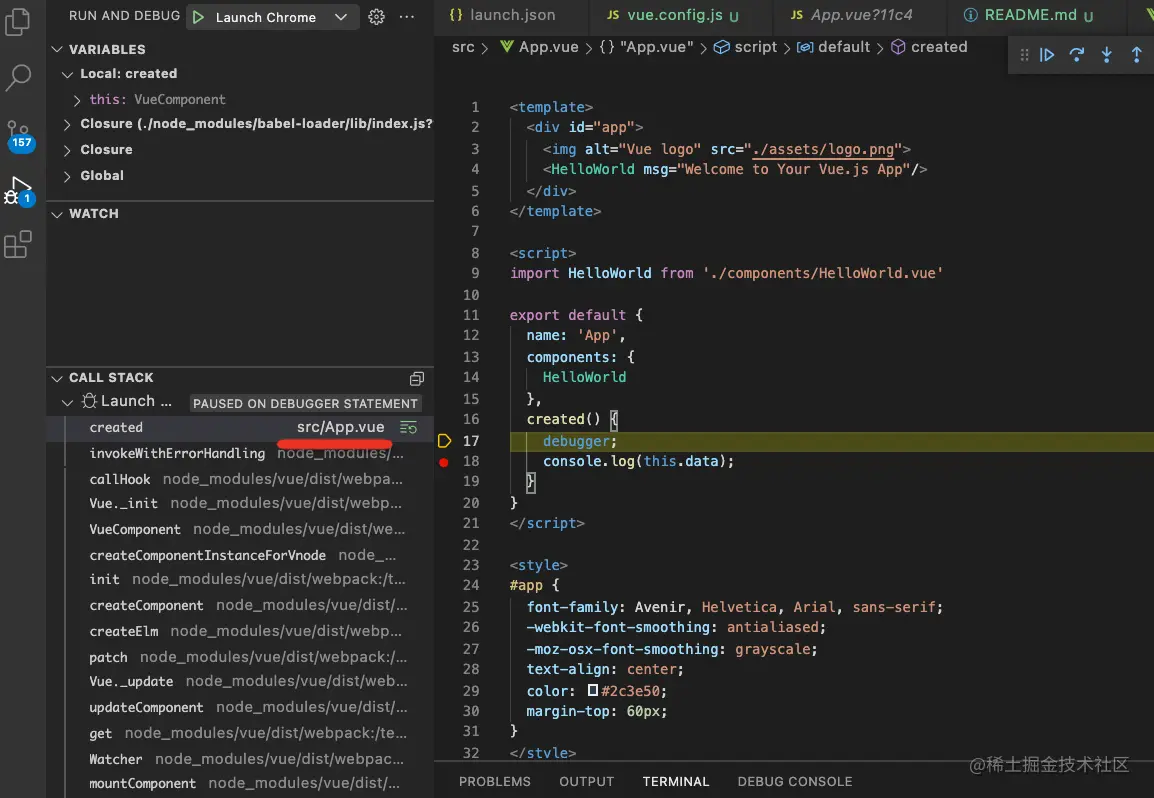
You can add a debugger to the source code and check the current mapped path in the browser:

webpack://test here -vue-debug/src/App.vue?11c4 is the path to be mapped, so where is it mapped to?
is obviously mapped to the local path, which is like this:

workspaceRoot is the environment variable provided by vscode, which is the path of the project. In this way After mapping, doesn't the address become a local file? Then the breakpoint will take effect in the local file:

Look at the path here, it is obviously mapped to the file under the project.
But when mapping, there is also a hash at the end. This hash will change. What should I do?
This path is configurable. This is actually the file path when webpack generates the sourcemap. It can be configured through output.devtoolModuleFilenameTemplate:
You can read the documentation for the available variables, so I won’t expand them here (just take a look at them):
For example, I configured the path like this:
The file path during debugging is like this:
Don’t worry about the prefix, just look at the following part. Isn’t this removed? Has it been hashed?
Then map it to the local file:
In this way, it is mapped again, and it is broken in vscode Click to take effect:
#Whether you want to debug Vue business code or want to see Vue source code, the experience will be very enjoyable.
Summary
As a front-end engineer, debugging Vue and React code is something you have to do every day. Different debugging methods have different experience and efficiency. So I want to introduce to you my commonly used method of debugging web pages with VSCode.
React debugging is relatively simple. Just add a chrome type debug configuration. Vue debugging is more troublesome. You need to do a path mapping. If there is a hash in the path, you also need to change the configuration of the generated path. Then map again (but it only needs to be configured once).
Using VSCode to debug React/Vue code is very convenient whether you are debugging business code or looking at the source code. You might as well give it a try, it will make debugging very enjoyable.
For more knowledge about VSCode, please visit: vscode tutorial! !
The above is the detailed content of How to configure VSCode, Su Shuang's debugging Vue and React code!. For more information, please follow other related articles on the PHP Chinese website!

Hot AI Tools

Undresser.AI Undress
AI-powered app for creating realistic nude photos

AI Clothes Remover
Online AI tool for removing clothes from photos.

Undress AI Tool
Undress images for free

Clothoff.io
AI clothes remover

Video Face Swap
Swap faces in any video effortlessly with our completely free AI face swap tool!

Hot Article

Hot Tools

Notepad++7.3.1
Easy-to-use and free code editor

SublimeText3 Chinese version
Chinese version, very easy to use

Zend Studio 13.0.1
Powerful PHP integrated development environment

Dreamweaver CS6
Visual web development tools

SublimeText3 Mac version
God-level code editing software (SublimeText3)

Hot Topics
 1673
1673
 14
14
 1428
1428
 52
52
 1333
1333
 25
25
 1278
1278
 29
29
 1257
1257
 24
24
 How to define header files for vscode
Apr 15, 2025 pm 09:09 PM
How to define header files using Visual Studio Code? Create a header file and declare symbols in the header file using the .h or .hpp suffix name (such as classes, functions, variables) Compile the program using the #include directive to include the header file in the source file. The header file will be included and the declared symbols are available.
 What computer configuration is required for vscode
Apr 15, 2025 pm 09:48 PM
VS Code system requirements: Operating system: Windows 10 and above, macOS 10.12 and above, Linux distribution processor: minimum 1.6 GHz, recommended 2.0 GHz and above memory: minimum 512 MB, recommended 4 GB and above storage space: minimum 250 MB, recommended 1 GB and above other requirements: stable network connection, Xorg/Wayland (Linux)
 How to solve the problem of vscode Chinese annotations becoming question marks
Apr 15, 2025 pm 11:36 PM
How to solve the problem that Chinese comments in Visual Studio Code become question marks: Check the file encoding and make sure it is "UTF-8 without BOM". Change the font to a font that supports Chinese characters, such as "Song Style" or "Microsoft Yahei". Reinstall the font. Enable Unicode support. Upgrade VSCode, restart the computer, and recreate the source file.
 vscode terminal usage tutorial
Apr 15, 2025 pm 10:09 PM
vscode built-in terminal is a development tool that allows running commands and scripts within the editor to simplify the development process. How to use vscode terminal: Open the terminal with the shortcut key (Ctrl/Cmd). Enter a command or run the script. Use hotkeys (such as Ctrl L to clear the terminal). Change the working directory (such as the cd command). Advanced features include debug mode, automatic code snippet completion, and interactive command history.
 Where to write code in vscode
Apr 15, 2025 pm 09:54 PM
Writing code in Visual Studio Code (VSCode) is simple and easy to use. Just install VSCode, create a project, select a language, create a file, write code, save and run it. The advantages of VSCode include cross-platform, free and open source, powerful features, rich extensions, and lightweight and fast.
 vscode Previous Next Shortcut Key
Apr 15, 2025 pm 10:51 PM
VS Code One-step/Next step shortcut key usage: One-step (backward): Windows/Linux: Ctrl ←; macOS: Cmd ←Next step (forward): Windows/Linux: Ctrl →; macOS: Cmd →
 Common commands for vscode terminal
Apr 15, 2025 pm 10:06 PM
Common commands for VS Code terminals include: Clear the terminal screen (clear), list the current directory file (ls), change the current working directory (cd), print the current working directory path (pwd), create a new directory (mkdir), delete empty directory (rmdir), create a new file (touch) delete a file or directory (rm), copy a file or directory (cp), move or rename a file or directory (mv) display file content (cat) view file content and scroll (less) view file content only scroll down (more) display the first few lines of the file (head)
 Can vs code run in Windows 8
Apr 15, 2025 pm 07:24 PM
VS Code can run on Windows 8, but the experience may not be great. First make sure the system has been updated to the latest patch, then download the VS Code installation package that matches the system architecture and install it as prompted. After installation, be aware that some extensions may be incompatible with Windows 8 and need to look for alternative extensions or use newer Windows systems in a virtual machine. Install the necessary extensions to check whether they work properly. Although VS Code is feasible on Windows 8, it is recommended to upgrade to a newer Windows system for a better development experience and security.


