
 Operation and Maintenance
Linux Operation and Maintenance
Practical tips to get a feel for your Linux memory, disk, CPU, and network
Operation and Maintenance
Linux Operation and Maintenance
Practical tips to get a feel for your Linux memory, disk, CPU, and network
Practical tips to get a feel for your Linux memory, disk, CPU, and network

This article brings you knowledge about how to check the various statuses of Linux in Linux, including: network IO, disk, CPU, memory and other related knowledge. I hope it will be helpful to everyone.

Today’s focus:
① Learn to check the various statuses of Linux, including: network IO, disk, CPU, Memory, etc.;
② Learn to understand the meaning of commands and be able to quickly discover problems in the cluster.
1. Core commands
linux monitors network IO, disk, CPU, memory:
- CPU: vmstat, sar –u, top
- Disk IO: iostat –xd, sar –d, top
- Network IO: iftop -n, ifstat, dstat –nt, sar -n DEV 2 3
- Disk capacity: df –h
- Memory usage: free – m, top
2, common commands
(1) Memory: number of bars, size of each bar, whether the memory is DDR4 or DDR3, memory frequency is 2666MT/S or 1600MT/s
number of entries: dmidecode|grep -A5 'Memory Device'|grep Size | grep -v Installed |wc -l
Size of each item: dmidecode|grep -A5 'Memory Device'|grep Size | grep -v Installed |uniq
Memory type: dmidecode | grep -A16 "Memory Device" | grep 'Type:' | grep -v Unknown |uniq
Memory frequency: dmidecode | grep -A16 "Memory Device" | grep 'Speed' | grep -v Unknown |uniq
(2) Hard disk: number of blocks, size
fdisk -l | grep "Disk /dev/sd"
(3) Check what process occupies the port
netstat -antp | fgrep
(4) Check the process resources
- jps -l # Get the process id
- jmap -heap 21046
(5) Number of CPUs
cat /proc/cpuinfo| grep "physical id"| sort| uniq| wc -l
(6)CPU core number
cat /proc/cpuinfo| grep "cpu cores"| uniq
(7)CPU frequency
cat /proc/cpuinfo| grep "model name"| uniq
3. Detailed explanation of core commands
3.1. ps aux
ps command is used to view the process status in the system
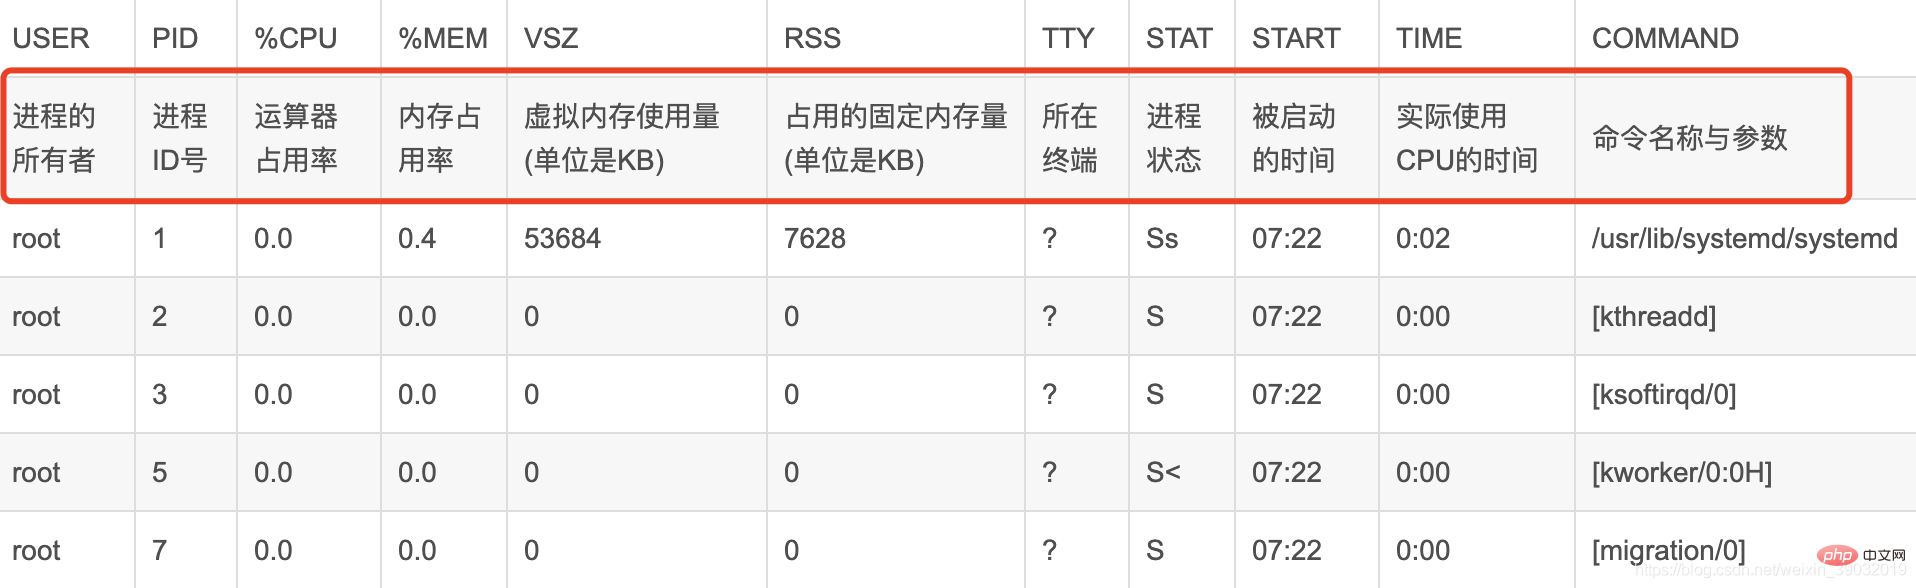
USER PID %CPU %MEM VSZ RSS TTY STAT START TIME COMMAND
● USER, the user name of the process owner.
● PID, process number, can uniquely identify the process.
● %CPU, the CPU time occupied by the process since the last refresh and the percentage of the total time.
● %MEM, the percentage of memory used by the process.
● VSZ, the virtual memory size used by the process, in K.
● RSS, the total amount of physical memory occupied by the process, in K.
● TTY, process-related terminal name.
● STAT, process status, used (R--running or ready to run; S--sleep state; I--idle; Z--frozen; D--uninterrupted sleep; W-process has no resident pages; T stop or track.) these letters to represent.
● START, the time when the process starts running.
● TIME, the total CPU time used by the process.
● COMMAND, the command line to be executed.
3.2. Top
The top command is a commonly used performance analysis tool under Linux, which can display the resource usage of each process in the system in real time, similar to Windows task manager.
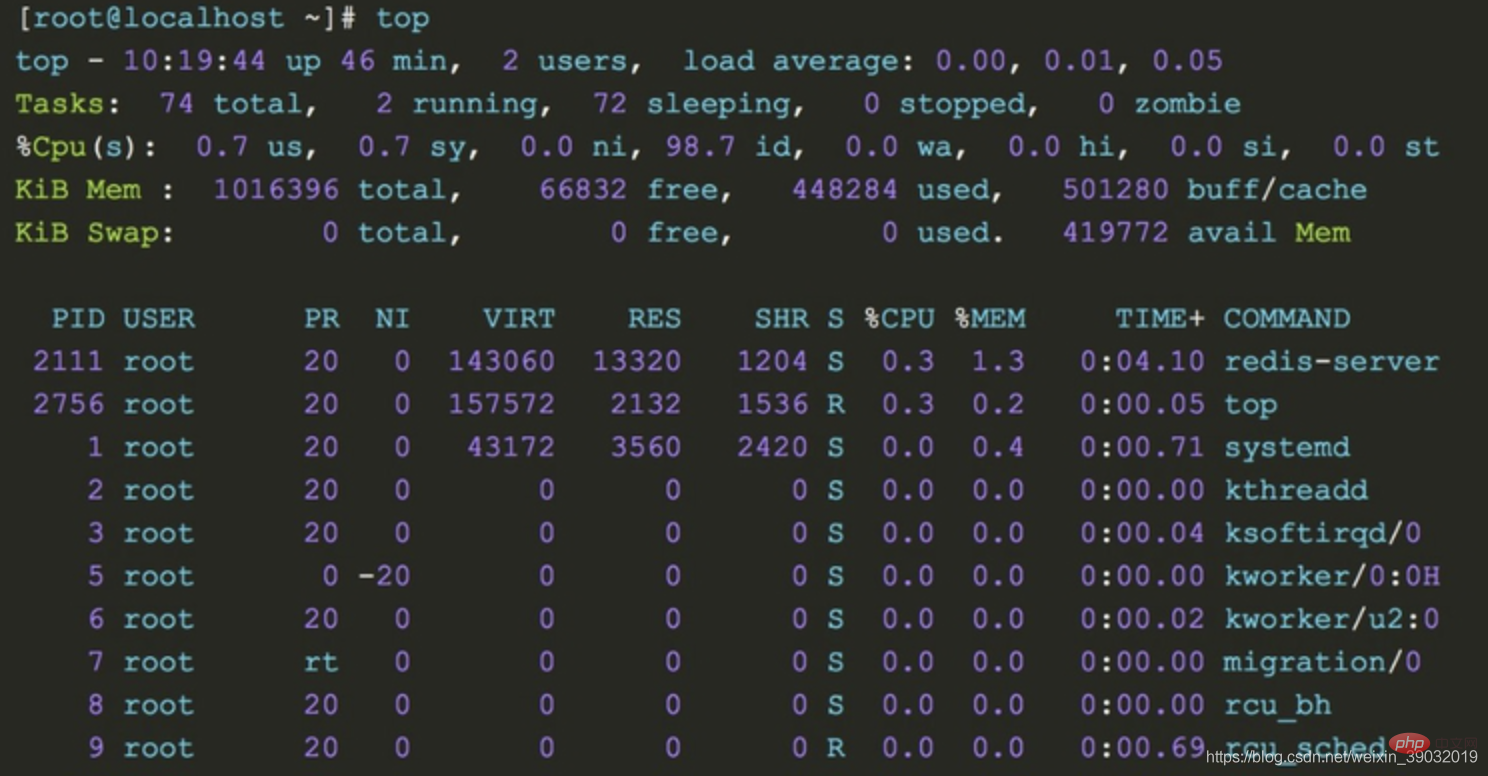
1. The upper part shows the overall system load:
- top row: From left to right are the current system time, system running time, and the average load value of the system’s CPU in the previous 1min, 5min, and 15min
- Tasks line: This line gives the overall statistical information of the process, including the total number of processes within the statistical period, the number of running processes, the number of dormant state processes, the number of stopped state processes and the number of zombie state processes
- Cpu(s) line: Overall cpu statistical information, including the ratio of cpu time occupied by processes in user mode and system mode. Processes with a nice value greater than 0 occupy the cpu time ratio in user mode. The cpu is in The time ratio of idle state, wait state, and the time ratio of processing hard interrupt and soft interrupt
- Mem line: This line provides memory statistics, including total physical memory, used Memory, free memory and the amount of memory used as buffer
- Swap line: Virtual memory statistics, including total amount of swap space, used swap area size, free swap area size and used The size of the swap space for caching
2. The lower part shows the running status of each process:
- PID : Process pid
- USER: The user who started the process
- PR: The column value plus 100 is the process priority, if the priority is less than 100, then the process is a real-time process, otherwise it is a normal process. The real-time process has a higher priority and is easier to obtain CPU scheduling. In the above output, the java process priority is 120, which is a normal process. Process, the priority of the had process is 2, which is a real-time process. The priority RT of the migration process corresponds to 0, which is the highest priority.
- NI: The nice priority value of the process, this column , the nice value of the real-time process is 0, and the nice value of the ordinary process ranges from -20~19
- VIRT: The size of the virtual memory occupied by the process (default unit kB)
- RES: The size of the physical memory occupied by the process (default unit kB)
- SHR: The size of the shared memory occupied by the process (default unit kB)
- S: The running status of the process
- %CPU: The percentage of CPU occupied by the process during the sampling period
- %MEM: Percentage of memory occupied by the process during the sampling period
- TIME : Total cpu time used by the process
- COMMAND: Command to pull up the process
1. Don’t panic if you encounter problems. Based on experience, you can then use commands to troubleshoot memory, disk, network, and CPU. The problems are just in these categories. You must not make changes in a hurry to complicate simple problems.
2. According to the above command, set the monitoring warning in advance. Monitoring and early warning can allow you to discover system performance information in time, such as the disk is almost full or the memory is overloaded. We can make adjustments in advance.
Related recommendations: "Linux Video Tutorial"
The above is the detailed content of Practical tips to get a feel for your Linux memory, disk, CPU, and network. For more information, please follow other related articles on the PHP Chinese website!

Hot AI Tools

Undresser.AI Undress
AI-powered app for creating realistic nude photos

AI Clothes Remover
Online AI tool for removing clothes from photos.

Undress AI Tool
Undress images for free

Clothoff.io
AI clothes remover

Video Face Swap
Swap faces in any video effortlessly with our completely free AI face swap tool!

Hot Article
Hot Tools

Notepad++7.3.1
Easy-to-use and free code editor

SublimeText3 Chinese version
Chinese version, very easy to use

Zend Studio 13.0.1
Powerful PHP integrated development environment

Dreamweaver CS6
Visual web development tools

SublimeText3 Mac version
God-level code editing software (SublimeText3)
Hot Topics


 What computer configuration is required for vscode
Apr 15, 2025 pm 09:48 PM
What computer configuration is required for vscode
Apr 15, 2025 pm 09:48 PM
VS Code system requirements: Operating system: Windows 10 and above, macOS 10.12 and above, Linux distribution processor: minimum 1.6 GHz, recommended 2.0 GHz and above memory: minimum 512 MB, recommended 4 GB and above storage space: minimum 250 MB, recommended 1 GB and above other requirements: stable network connection, Xorg/Wayland (Linux)
 How to run java code in notepad
Apr 16, 2025 pm 07:39 PM
How to run java code in notepad
Apr 16, 2025 pm 07:39 PM
Although Notepad cannot run Java code directly, it can be achieved by using other tools: using the command line compiler (javac) to generate a bytecode file (filename.class). Use the Java interpreter (java) to interpret bytecode, execute the code, and output the result.
 Linux Architecture: Unveiling the 5 Basic Components
Apr 20, 2025 am 12:04 AM
Linux Architecture: Unveiling the 5 Basic Components
Apr 20, 2025 am 12:04 AM
The five basic components of the Linux system are: 1. Kernel, 2. System library, 3. System utilities, 4. Graphical user interface, 5. Applications. The kernel manages hardware resources, the system library provides precompiled functions, system utilities are used for system management, the GUI provides visual interaction, and applications use these components to implement functions.
 vscode cannot install extension
Apr 15, 2025 pm 07:18 PM
vscode cannot install extension
Apr 15, 2025 pm 07:18 PM
The reasons for the installation of VS Code extensions may be: network instability, insufficient permissions, system compatibility issues, VS Code version is too old, antivirus software or firewall interference. By checking network connections, permissions, log files, updating VS Code, disabling security software, and restarting VS Code or computers, you can gradually troubleshoot and resolve issues.
 How to check the warehouse address of git
Apr 17, 2025 pm 01:54 PM
How to check the warehouse address of git
Apr 17, 2025 pm 01:54 PM
To view the Git repository address, perform the following steps: 1. Open the command line and navigate to the repository directory; 2. Run the "git remote -v" command; 3. View the repository name in the output and its corresponding address.
 Can vscode be used for mac
Apr 15, 2025 pm 07:36 PM
Can vscode be used for mac
Apr 15, 2025 pm 07:36 PM
VS Code is available on Mac. It has powerful extensions, Git integration, terminal and debugger, and also offers a wealth of setup options. However, for particularly large projects or highly professional development, VS Code may have performance or functional limitations.
 How to use VSCode
Apr 15, 2025 pm 11:21 PM
How to use VSCode
Apr 15, 2025 pm 11:21 PM
Visual Studio Code (VSCode) is a cross-platform, open source and free code editor developed by Microsoft. It is known for its lightweight, scalability and support for a wide range of programming languages. To install VSCode, please visit the official website to download and run the installer. When using VSCode, you can create new projects, edit code, debug code, navigate projects, expand VSCode, and manage settings. VSCode is available for Windows, macOS, and Linux, supports multiple programming languages and provides various extensions through Marketplace. Its advantages include lightweight, scalability, extensive language support, rich features and version
 vscode terminal usage tutorial
Apr 15, 2025 pm 10:09 PM
vscode terminal usage tutorial
Apr 15, 2025 pm 10:09 PM
vscode built-in terminal is a development tool that allows running commands and scripts within the editor to simplify the development process. How to use vscode terminal: Open the terminal with the shortcut key (Ctrl/Cmd). Enter a command or run the script. Use hotkeys (such as Ctrl L to clear the terminal). Change the working directory (such as the cd command). Advanced features include debug mode, automatic code snippet completion, and interactive command history.
