

How to install and use xhprof performance analysis tool under PHP7

This article will introduce to you how to install and use the xhprof performance analysis tool under PHP7. It has certain reference value. Friends in need can refer to it. I hope it will be helpful to everyone.

The xhprof version is obtained from https://github.com/longxinH/xhprof
git clone https://github.com/longxinH/xhprof
Install xhprof
cd xhprof/extension/
phpize
./configure
make
make install
and then Add
extension=xhprof.so
to /etc/php.ini according to the situation. Execute
php -m | grep xhprof
You can see the output, indicating that the php extension is installed successfully, and then restart Apache or php-fpm
Run
You can directly run the example in the example directory in the file cloned from github
The output is as follows
Array
(
    [main()] => Array
        (
            [ct] => 1
            [wt] => 9
        )

)
---------------
Assuming you have set up the http based UI for
XHProf at some address, you can view run at
http://<xhprof-ui-address>/index.php?run=592567308784c&source=xhprof_foo
---------------Then copy the ?run=592567308784c&source=xhprof_foo after index.php
Visit
xhprof_html/index.php?run=592567308784c&source=xhprof_foo
You can see the output
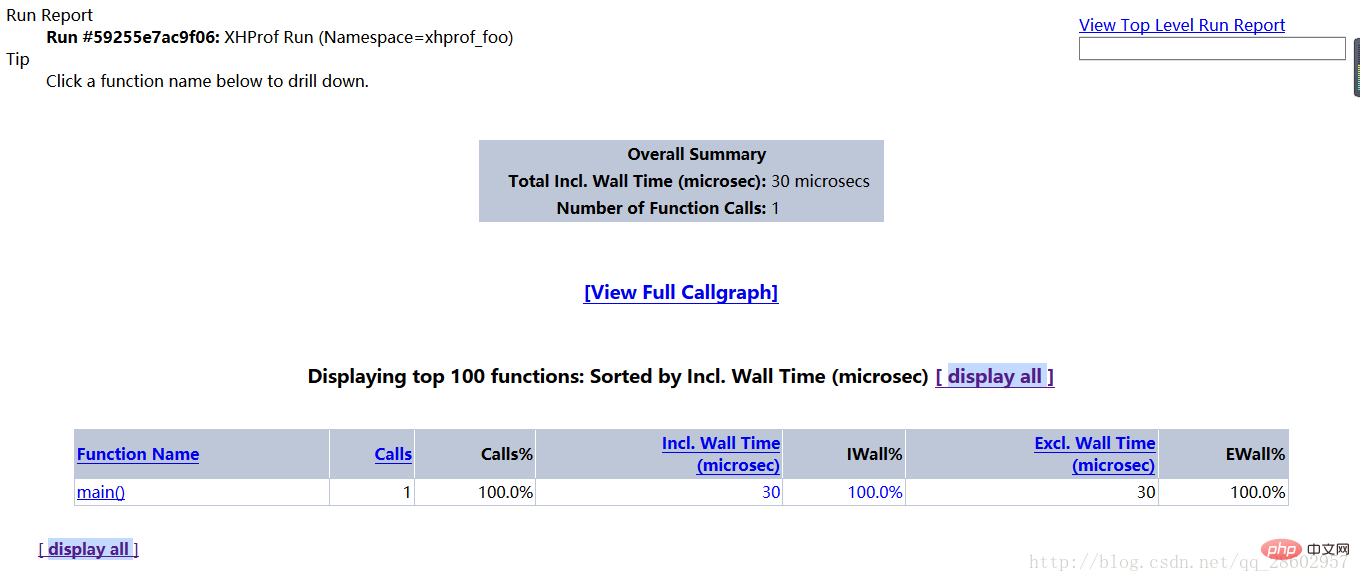
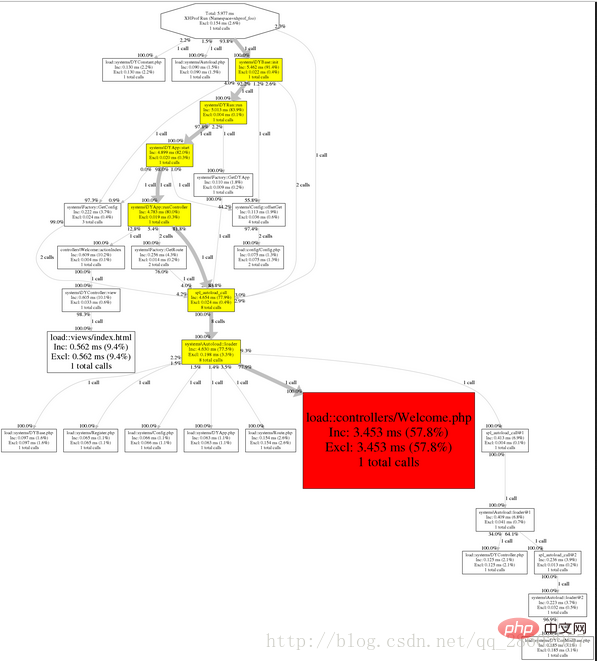
Click View Full Callgraph in the middle to see the performance analysis picture
Error reporting
failed to execute cmd:" dot -Tpng". stderr:sh: dot:command not found。
//解决方案
yum install graphviz
Adapt to changes
For example, if you want to test your own project, such as performance analysis of a framework.
Copy the two files under xhprof_lib/utils/
xhprof_lib.php and xhprof_runs.php to the same directory as the entry file, and then add
// start profiling
xhprof_enable();
// stop profiler
$xhprof_data = xhprof_disable();

// display raw xhprof data for the profiler run
print_r($xhprof_data);


include_once "xhprof_lib.php";
include_once "xhprof_runs.php";

// save raw data for this profiler run using default
// implementation of iXHProfRuns.
$xhprof_runs = new XHProfRuns_Default();

// save the run under a namespace "xhprof_foo"
$run_id = $xhprof_runs->save_run($xhprof_data, "xhprof_foo");

echo "---------------\n".
     "Assuming you have set up the http based UI for \n".
     "XHProf at some address, you can view run at \n".
     "http://<xhprof-ui-address>/index.php?run=$run_id&source=xhprof_foo\n".
"---------------\n";http://***/xhprof_html/index.php?run=*****&source=xhprof_foo
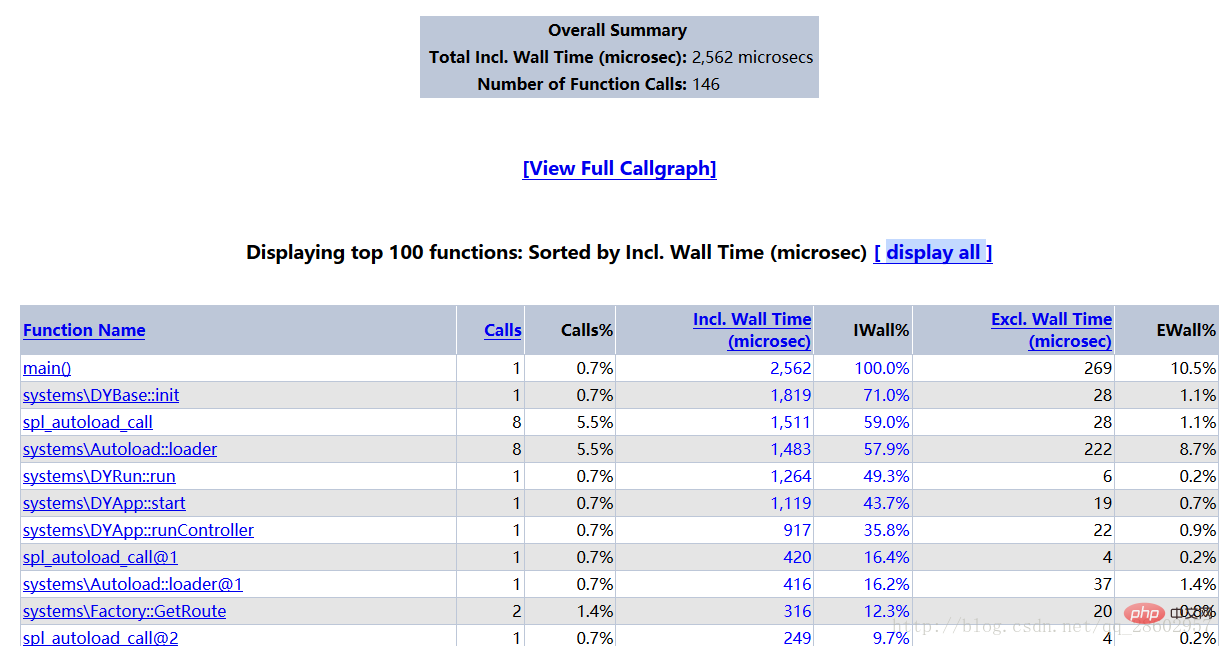
- Function Name: method name.
- Calls: The number of times the method has been called.
- Calls%: The number of method calls as a percentage of the total number of method calls at the same level.
- Incl.Wall Time (microsec): The time it takes for method execution, including the execution time of sub-methods. (Unit: microsecond)
- IWall%: The percentage of time spent in method execution.
- Excl. Wall Time (microsec): The time it takes to execute the method itself, excluding the execution time of sub-methods. (Unit: microsecond)
- EWall%: The percentage of time spent executing the method itself.
- Incl. CPU (microsecs): The CPU time spent on method execution, including the execution time of sub-methods. (Unit: microsecond)
- ICpu%: The percentage of CPU time spent in method execution.
- Excl. CPU (microsec): The CPU time spent executing the method itself, excluding the execution time of sub-methods. (Unit: microsecond)
- ECPU%: The percentage of CPU time spent executing the method itself.
- Incl.MemUse(bytes): The memory occupied by method execution, including the memory occupied by sub-method execution. (Unit: Bytes)
- IMemUse%: The percentage of memory occupied by method execution.
- Excl.MemUse(bytes): The memory occupied by the execution of the method itself, excluding the memory occupied by the execution of sub-methods. (Unit: Bytes)
- EMemUse%: The percentage of memory occupied by the method itself.
- Incl.PeakMemUse(bytes): Incl.MemUse peak value. (Unit: Bytes)
- IPeakMemUse%: Incl.MemUse peak percentage.
- Excl.PeakMemUse(bytes): Excl.MemUse peak value. Unit: (byte)
- EPeakMemUse%: Excl.MemUse peak percentage.
The above is the detailed content of How to install and use xhprof performance analysis tool under PHP7. For more information, please follow other related articles on the PHP Chinese website!

Hot AI Tools

Undresser.AI Undress
AI-powered app for creating realistic nude photos

AI Clothes Remover
Online AI tool for removing clothes from photos.

Undress AI Tool
Undress images for free

Clothoff.io
AI clothes remover

Video Face Swap
Swap faces in any video effortlessly with our completely free AI face swap tool!

Hot Article
Hot Tools

Notepad++7.3.1
Easy-to-use and free code editor

SublimeText3 Chinese version
Chinese version, very easy to use

Zend Studio 13.0.1
Powerful PHP integrated development environment

Dreamweaver CS6
Visual web development tools

SublimeText3 Mac version
God-level code editing software (SublimeText3)
Hot Topics


 PHP 8.4 Installation and Upgrade guide for Ubuntu and Debian
Dec 24, 2024 pm 04:42 PM
PHP 8.4 Installation and Upgrade guide for Ubuntu and Debian
Dec 24, 2024 pm 04:42 PM
PHP 8.4 brings several new features, security improvements, and performance improvements with healthy amounts of feature deprecations and removals. This guide explains how to install PHP 8.4 or upgrade to PHP 8.4 on Ubuntu, Debian, or their derivati
 7 PHP Functions I Regret I Didn't Know Before
Nov 13, 2024 am 09:42 AM
7 PHP Functions I Regret I Didn't Know Before
Nov 13, 2024 am 09:42 AM
If you are an experienced PHP developer, you might have the feeling that you’ve been there and done that already.You have developed a significant number of applications, debugged millions of lines of code, and tweaked a bunch of scripts to achieve op
 How To Set Up Visual Studio Code (VS Code) for PHP Development
Dec 20, 2024 am 11:31 AM
How To Set Up Visual Studio Code (VS Code) for PHP Development
Dec 20, 2024 am 11:31 AM
Visual Studio Code, also known as VS Code, is a free source code editor — or integrated development environment (IDE) — available for all major operating systems. With a large collection of extensions for many programming languages, VS Code can be c
 Explain JSON Web Tokens (JWT) and their use case in PHP APIs.
Apr 05, 2025 am 12:04 AM
Explain JSON Web Tokens (JWT) and their use case in PHP APIs.
Apr 05, 2025 am 12:04 AM
JWT is an open standard based on JSON, used to securely transmit information between parties, mainly for identity authentication and information exchange. 1. JWT consists of three parts: Header, Payload and Signature. 2. The working principle of JWT includes three steps: generating JWT, verifying JWT and parsing Payload. 3. When using JWT for authentication in PHP, JWT can be generated and verified, and user role and permission information can be included in advanced usage. 4. Common errors include signature verification failure, token expiration, and payload oversized. Debugging skills include using debugging tools and logging. 5. Performance optimization and best practices include using appropriate signature algorithms, setting validity periods reasonably,
 PHP Program to Count Vowels in a String
Feb 07, 2025 pm 12:12 PM
PHP Program to Count Vowels in a String
Feb 07, 2025 pm 12:12 PM
A string is a sequence of characters, including letters, numbers, and symbols. This tutorial will learn how to calculate the number of vowels in a given string in PHP using different methods. The vowels in English are a, e, i, o, u, and they can be uppercase or lowercase. What is a vowel? Vowels are alphabetic characters that represent a specific pronunciation. There are five vowels in English, including uppercase and lowercase: a, e, i, o, u Example 1 Input: String = "Tutorialspoint" Output: 6 explain The vowels in the string "Tutorialspoint" are u, o, i, a, o, i. There are 6 yuan in total
 How do you parse and process HTML/XML in PHP?
Feb 07, 2025 am 11:57 AM
How do you parse and process HTML/XML in PHP?
Feb 07, 2025 am 11:57 AM
This tutorial demonstrates how to efficiently process XML documents using PHP. XML (eXtensible Markup Language) is a versatile text-based markup language designed for both human readability and machine parsing. It's commonly used for data storage an
 Explain late static binding in PHP (static::).
Apr 03, 2025 am 12:04 AM
Explain late static binding in PHP (static::).
Apr 03, 2025 am 12:04 AM
Static binding (static::) implements late static binding (LSB) in PHP, allowing calling classes to be referenced in static contexts rather than defining classes. 1) The parsing process is performed at runtime, 2) Look up the call class in the inheritance relationship, 3) It may bring performance overhead.
 What are PHP magic methods (__construct, __destruct, __call, __get, __set, etc.) and provide use cases?
Apr 03, 2025 am 12:03 AM
What are PHP magic methods (__construct, __destruct, __call, __get, __set, etc.) and provide use cases?
Apr 03, 2025 am 12:03 AM
What are the magic methods of PHP? PHP's magic methods include: 1.\_\_construct, used to initialize objects; 2.\_\_destruct, used to clean up resources; 3.\_\_call, handle non-existent method calls; 4.\_\_get, implement dynamic attribute access; 5.\_\_set, implement dynamic attribute settings. These methods are automatically called in certain situations, improving code flexibility and efficiency.
