 Operation and Maintenance
 Windows Operation and Maintenance
 What should I do if the browser automatically opens when Windows 10 is started?
What should I do if the browser automatically opens when Windows 10 is started?
The solution to the problem that the browser automatically opens when Windows 10 starts up: first open the local group policy editor and enter the Internet communication settings option; then find the [Turn off Windows Network Connection Status Indicator Activity Test] option, double-click to open it; finally check the Select [Enabled] and click [OK].

#The operating environment of this article: windows10 system, thinkpad t480 computer.
The solution is as follows:
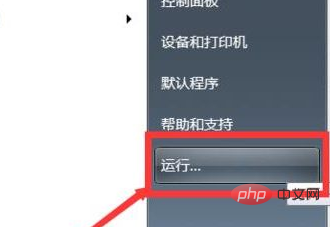
First click the start menu in the lower left corner - open "Run" (or press the "Win R" key combination to call out run) and enter "gpedit.msc" in the box Press the Enter key to open the "Local Group Policy Editor";

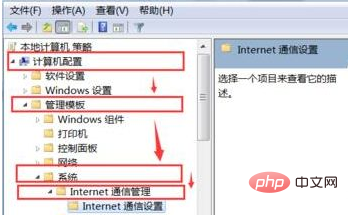
#Then expand the local policy group: Computer Configuration - Administrative Templates - System - Internet Communication Management - Internet Communication Settings;

Finally, double-click on the right to open "Turn off Windows Network Connection Status Indicator Activity Test", select "Enable", click Apply and OK That’s it; after the setting is completed, the browser will no longer automatically pop up when you turn on the computer.

Related recommendations: windows system
The above is the detailed content of What should I do if the browser automatically opens when Windows 10 is started?. For more information, please follow other related articles on the PHP Chinese website!

Hot AI Tools

Undresser.AI Undress
AI-powered app for creating realistic nude photos

AI Clothes Remover
Online AI tool for removing clothes from photos.

Undress AI Tool
Undress images for free

Clothoff.io
AI clothes remover

Video Face Swap
Swap faces in any video effortlessly with our completely free AI face swap tool!

Hot Article

Hot Tools

Notepad++7.3.1
Easy-to-use and free code editor

SublimeText3 Chinese version
Chinese version, very easy to use

Zend Studio 13.0.1
Powerful PHP integrated development environment

Dreamweaver CS6
Visual web development tools

SublimeText3 Mac version
God-level code editing software (SublimeText3)

Hot Topics
 What is apache server? What is apache server for?
Apr 13, 2025 am 11:57 AM
Apache server is a powerful web server software that acts as a bridge between browsers and website servers. 1. It handles HTTP requests and returns web page content based on requests; 2. Modular design allows extended functions, such as support for SSL encryption and dynamic web pages; 3. Configuration files (such as virtual host configurations) need to be carefully set to avoid security vulnerabilities, and optimize performance parameters, such as thread count and timeout time, in order to build high-performance and secure web applications.
 Solve caching issues in Craft CMS: Using wiejeben/craft-laravel-mix plug-in
Apr 18, 2025 am 09:24 AM
When developing websites using CraftCMS, you often encounter resource file caching problems, especially when you frequently update CSS and JavaScript files, old versions of files may still be cached by the browser, causing users to not see the latest changes in time. This problem not only affects the user experience, but also increases the difficulty of development and debugging. Recently, I encountered similar troubles in my project, and after some exploration, I found the plugin wiejeben/craft-laravel-mix, which perfectly solved my caching problem.
 Tips for using HDFS file system on CentOS
Apr 14, 2025 pm 07:30 PM
The Installation, Configuration and Optimization Guide for HDFS File System under CentOS System This article will guide you how to install, configure and optimize Hadoop Distributed File System (HDFS) on CentOS System. HDFS installation and configuration Java environment installation: First, make sure that the appropriate Java environment is installed. Edit /etc/profile file, add the following, and replace /usr/lib/java-1.8.0/jdk1.8.0_144 with your actual Java installation path: exportJAVA_HOME=/usr/lib/java-1.8.0/jdk1.8.0_144exportPATH=$J
 Nginx performance monitoring and troubleshooting tools
Apr 13, 2025 pm 10:00 PM
Nginx performance monitoring and troubleshooting are mainly carried out through the following steps: 1. Use nginx-V to view version information, and enable the stub_status module to monitor the number of active connections, requests and cache hit rate; 2. Use top command to monitor system resource occupation, iostat and vmstat monitor disk I/O and memory usage respectively; 3. Use tcpdump to capture packets to analyze network traffic and troubleshoot network connection problems; 4. Properly configure the number of worker processes to avoid insufficient concurrent processing capabilities or excessive process context switching overhead; 5. Correctly configure Nginx cache to avoid improper cache size settings; 6. By analyzing Nginx logs, such as using awk and grep commands or ELK
 How to monitor HDFS status on CentOS
Apr 14, 2025 pm 07:33 PM
There are many ways to monitor the status of HDFS (Hadoop Distributed File System) on CentOS systems. This article will introduce several commonly used methods to help you choose the most suitable solution. 1. Use Hadoop’s own WebUI, Hadoop’s own Web interface to provide cluster status monitoring function. Steps: Make sure the Hadoop cluster is up and running. Access the WebUI: Enter http://:50070 (Hadoop2.x) or http://:9870 (Hadoop3.x) in your browser. The default username and password are usually hdfs/hdfs. 2. Command line tool monitoring Hadoop provides a series of command line tools to facilitate monitoring
 How to configure HTTPS server in Debian OpenSSL
Apr 13, 2025 am 11:03 AM
Configuring an HTTPS server on a Debian system involves several steps, including installing the necessary software, generating an SSL certificate, and configuring a web server (such as Apache or Nginx) to use an SSL certificate. Here is a basic guide, assuming you are using an ApacheWeb server. 1. Install the necessary software First, make sure your system is up to date and install Apache and OpenSSL: sudoaptupdatesudoaptupgradesudoaptinsta
 Nginx Server Installation and Quick Configuration Guide
Apr 13, 2025 pm 10:18 PM
This article introduces the construction and configuration methods of Nginx. 1. Install Nginx: Use sudoyumininstallnginx on CentOS, use sudoapt-getinstallnginx on Ubuntu, and start with sudosystemctlstartnginx after installation. 2. Basic configuration: Modify the /etc/nginx/nginx.conf file, mainly modify the listen (port) and root (site root directory) instructions in the server block, and after modification, use sudosystemctlrestartnginx to restart and take effect. 3. Virtual host configuration: in nginx.co
 How to view thread status in Tomcat log
Apr 13, 2025 am 08:36 AM
To view the thread status in the Tomcat log, you can use the following methods: TomcatManagerWeb interface: Enter the management address of Tomcat (usually http://localhost:8080/manager) in the browser, and you can view the status of the thread pool after logging in. JMX Monitoring: Use JMX monitoring tools (such as JConsole) to connect to Tomcat's MBean server to view the status of Tomcat's thread pool. Select in JConsole


