
 Backend Development
Python Tutorial
Python homework: histogram, equalization, Gaussian filtering
Backend Development
Python Tutorial
Python homework: histogram, equalization, Gaussian filtering
Python homework: histogram, equalization, Gaussian filtering


Python histogram, equalization, Gaussian filtering
- Test original image
- Histogram
- Basic principle
- matplotlib library draws histogram
- RGB three-channel histogram
- Histogram equalization
- Basic principle
- PCV library completes histogram equalization
- Gaussian filter
- Basic principles
Opencv Gaussian filter implementation
##(Free learning recommendation: python video tutorial)
Test original image

Histogram
Basic Principles
What is a histogram: Histogram of an image Describes the relationship between the gray level of an image and the number of times (frequency) that the corresponding gray level appears in the image. Through the histogram, image segmentation, retrieval, classification and other operations can be performed.
hist function of the matplotlib library : The hist function can help draw histograms. It has many parameters, the first two parameters are used here: x, bins. The x parameter represents a one-dimensional array of pixels. If the array is more than one dimension, it can be flattened into one dimension using the flatten method. Generally speaking, reading a picture is a two-dimensional matrix, which requires flattening. The bins parameter indicates the number of columns to display the histogram
Assume there is a two-dimensional array img=[[159,120,130],[100,84,92],[168,150,212]]. The number represents the pixel value of the image. After flattening, img=[159,120,130,100,84,92,168,150,212]. The histogram drawn using the hist function is as shown below. The horizontal axis represents the pixel value, and the vertical axis represents the frequency of occurrence of the pixel value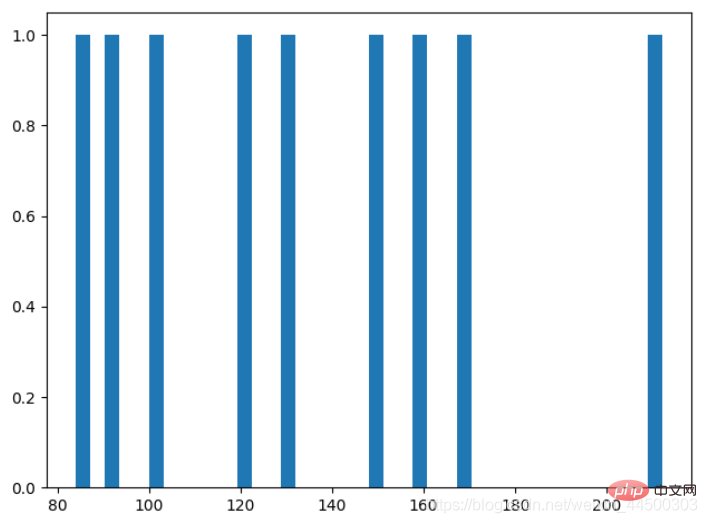
cv2.calcHist() provided by opencv draws a histogram: The calcHist function needs to pass in the read Picture image; the channels of the image, if it is a grayscale image channels=0, if it is the r, g, and b channels respectively, then 0, 1, and 2 are passed in.
matplotlib library for drawing histograms
Textbook codefrom PIL import Imagefrom pylab import *# 解决中文乱码plt.rcParams['font.sans-serif'] = 'SimHei'plt.rcParams['axes.unicode_minus'] = False#im = array(Image.open('headimage.jpeg').convert('L')) # 打开图像,并转成灰度图像print(im)figure()subplot(121)gray()contour(im, origin='image') #画图axis('equal') # 自动调整比例axis('off') # 去除x y轴上的刻度title(u'图像轮廓')subplot(122)# flatten()函数可以执行展平操作,返回一个一维数组hist(im.flatten(), 128)print(im.flatten())title(u'图像直方图')plt.xlim([0,260])plt.ylim([0,11000])show()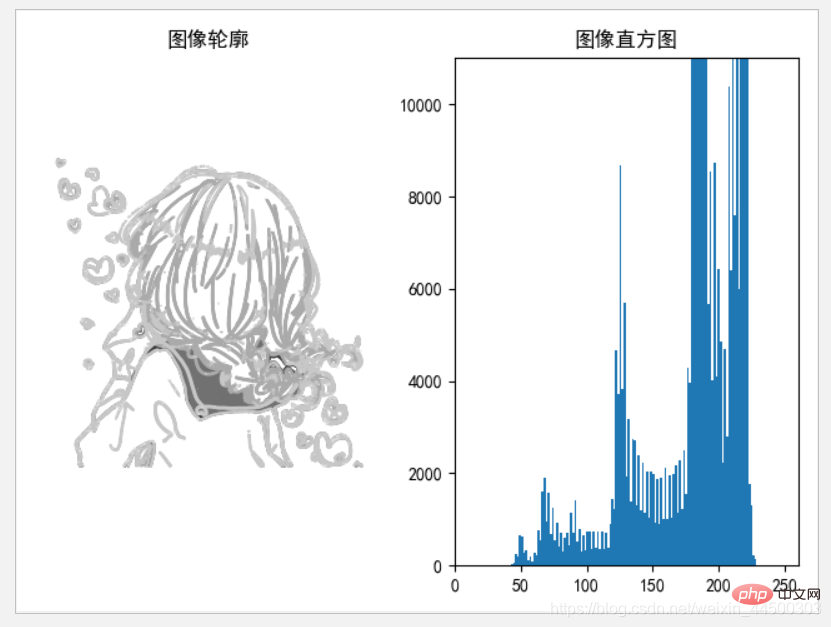
RGB Three-channel histogram
Code implementationimport cv2from matplotlib import pyplot as plt
img = cv2.imread('headimage.jpeg',1)color = ('b','g','r')for i,col in enumerate(color):
histr = cv2.calcHist([img],[i],None,[256],[0,256])
plt.plot(histr,color = col)
plt.xlim([0,256])plt.show()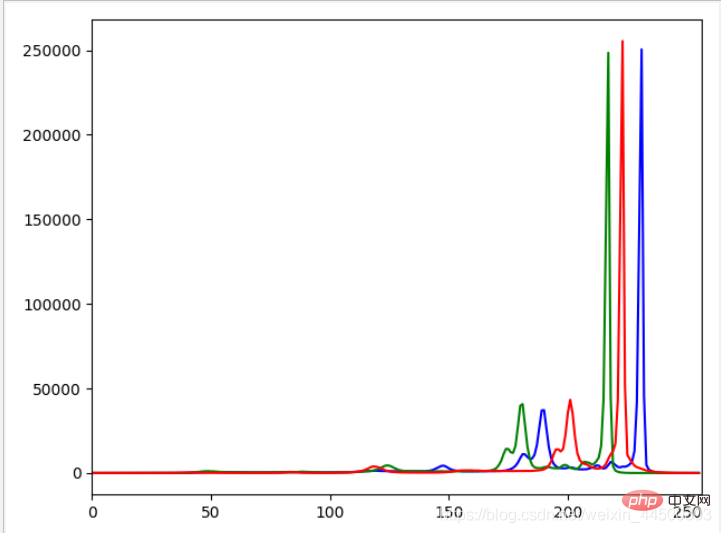
Histogram equalization
Basic Principle
What is histogram equalization: Histogram equalization uses the histogram of the image to adjust the contrast, which is a type of image enhancement. method. Intuitively, from the picture, the equalized picture has stronger contrast, is clearer, and has more obvious features; from the histogram, the frequency of the histogram gray value of the equalized picture is more uniform.
How to equalize the histogram:
- Histogram equalization must first read a picture img and calculate the histogram value of the picture imhist (You can use the histogram function).
- After getting the value of the histogram, you need to calculate the cumulative histogram cdf of the histogram (cdf[i] is equal to the sum of imhist[0] to imhist[i], which can be obtained directly using the cumsum function).
- The last step is to equalize the histogram. For the pixel value img[i, j] in the
- i row and j# column of the picture, use the formula img[i, j] = cdf[ img[i,j] ] / (m*n)*255 is calculated to obtain the equalized pixel value, and then the histogram of the equalized picture is calculated to obtain the equalized histogram. Figure
Use the histeq function of the PCV library to equalize : Pass in the image im and return the equalized histogram and cumulative histogram cdf.
PCV library completes histogram equalization
Textbook code# -*- coding: utf-8 -*-from PIL import Imagefrom pylab import *from PCV.tools import imtools# 添加中文字体支持from matplotlib.font_manager import FontProperties
font = FontProperties(fname=r"c:\windows\fonts\SimSun.ttc", size=14)im = array(Image.open('Python homework: histogram, equalization, Gaussian filtering').convert('L')) # 打开图像,并转成灰度图像im2, cdf = imtools.histeq(im)figure()subplot(2, 2, 1)axis('off')gray()title(u'原始图像', fontproperties=font)imshow(im)subplot(2, 2, 2)axis('off')title(u'直方图均衡化后的图像', fontproperties=font)imshow(im2)subplot(2, 2, 3)axis('off')title(u'原始直方图', fontproperties=font)hist(im.flatten(), 128, density=True)subplot(2, 2, 4)axis('off')title(u'均衡化后的直方图', fontproperties=font)hist(im2.flatten(), 128, density=True)show()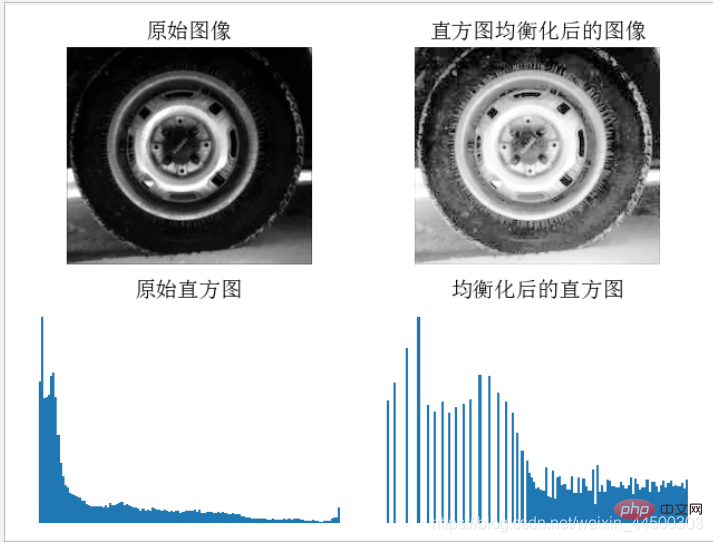 can be obtained by running the results , because the original image is overall darker (black), so the histogram of the original image appears more frequently in low pixels and less frequently in high pixels. After histogram equalization, the image as a whole becomes brighter. Observing the histogram, it is found that the frequency of low pixels has decreased, while the frequency of high pixels has increased, giving the image a more obvious contrast
Gaussian Filtering
##Basic PrinciplesWhat is Gaussian filtering
: Gaussian filtering is a linear smoothing filter that uses normal distribution for Image processing is suitable for eliminating Gaussian noise, and can blur the image to smooth the image and produce a blurred effect on the image. 高斯滤波原理:高斯滤波是用户指定一个模板,然后通过这个模板对图像进行卷积,所进行的卷积操作就是将模板中心周围的像素值进行加权平均后替换模板中心的像素值 opencv高斯滤波实现 代码实现 Python homework: histogram, equalization, Gaussian filtering 相关免费学习推荐:python教程(视频)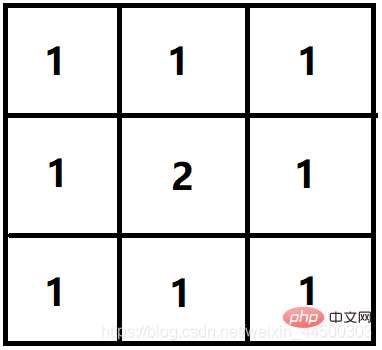
import cv2import matplotlib.pyplot as plt

im=cv2.imread("Python homework: histogram, equalization, Gaussian filtering")# 高斯滤波img_Guassian = cv2.GaussianBlur(im,(5,5),0)plt.subplot(121)plt.imshow(im)plt.subplot(122)plt.imshow(img_Guassian)plt.show()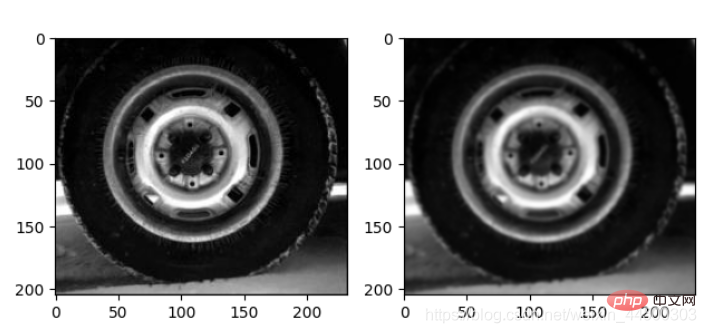
从Python homework: histogram, equalization, Gaussian filtering中可以看出,经过高斯滤波后的图像变得模糊了,边缘变得没有那么明显,图像变得平滑
The above is the detailed content of Python homework: histogram, equalization, Gaussian filtering. For more information, please follow other related articles on the PHP Chinese website!

Hot AI Tools

Undresser.AI Undress
AI-powered app for creating realistic nude photos

AI Clothes Remover
Online AI tool for removing clothes from photos.

Undress AI Tool
Undress images for free

Clothoff.io
AI clothes remover

Video Face Swap
Swap faces in any video effortlessly with our completely free AI face swap tool!

Hot Article
Hot Tools

Notepad++7.3.1
Easy-to-use and free code editor

SublimeText3 Chinese version
Chinese version, very easy to use

Zend Studio 13.0.1
Powerful PHP integrated development environment

Dreamweaver CS6
Visual web development tools

SublimeText3 Mac version
God-level code editing software (SublimeText3)
Hot Topics
 1653
1653
 14
1413
52
1306
25
1251
29
1224
24
14
1413
52
1306
25
1251
29
1224
24

 PHP and Python: Different Paradigms Explained
Apr 18, 2025 am 12:26 AM
PHP and Python: Different Paradigms Explained
Apr 18, 2025 am 12:26 AM
PHP is mainly procedural programming, but also supports object-oriented programming (OOP); Python supports a variety of paradigms, including OOP, functional and procedural programming. PHP is suitable for web development, and Python is suitable for a variety of applications such as data analysis and machine learning.
 Choosing Between PHP and Python: A Guide
Apr 18, 2025 am 12:24 AM
Choosing Between PHP and Python: A Guide
Apr 18, 2025 am 12:24 AM
PHP is suitable for web development and rapid prototyping, and Python is suitable for data science and machine learning. 1.PHP is used for dynamic web development, with simple syntax and suitable for rapid development. 2. Python has concise syntax, is suitable for multiple fields, and has a strong library ecosystem.
 PHP and Python: A Deep Dive into Their History
Apr 18, 2025 am 12:25 AM
PHP and Python: A Deep Dive into Their History
Apr 18, 2025 am 12:25 AM
PHP originated in 1994 and was developed by RasmusLerdorf. It was originally used to track website visitors and gradually evolved into a server-side scripting language and was widely used in web development. Python was developed by Guidovan Rossum in the late 1980s and was first released in 1991. It emphasizes code readability and simplicity, and is suitable for scientific computing, data analysis and other fields.
 Python vs. JavaScript: The Learning Curve and Ease of Use
Apr 16, 2025 am 12:12 AM
Python vs. JavaScript: The Learning Curve and Ease of Use
Apr 16, 2025 am 12:12 AM
Python is more suitable for beginners, with a smooth learning curve and concise syntax; JavaScript is suitable for front-end development, with a steep learning curve and flexible syntax. 1. Python syntax is intuitive and suitable for data science and back-end development. 2. JavaScript is flexible and widely used in front-end and server-side programming.
 How to run sublime code python
Apr 16, 2025 am 08:48 AM
How to run sublime code python
Apr 16, 2025 am 08:48 AM
To run Python code in Sublime Text, you need to install the Python plug-in first, then create a .py file and write the code, and finally press Ctrl B to run the code, and the output will be displayed in the console.
 Can vs code run in Windows 8
Apr 15, 2025 pm 07:24 PM
Can vs code run in Windows 8
Apr 15, 2025 pm 07:24 PM
VS Code can run on Windows 8, but the experience may not be great. First make sure the system has been updated to the latest patch, then download the VS Code installation package that matches the system architecture and install it as prompted. After installation, be aware that some extensions may be incompatible with Windows 8 and need to look for alternative extensions or use newer Windows systems in a virtual machine. Install the necessary extensions to check whether they work properly. Although VS Code is feasible on Windows 8, it is recommended to upgrade to a newer Windows system for a better development experience and security.
 Where to write code in vscode
Apr 15, 2025 pm 09:54 PM
Where to write code in vscode
Apr 15, 2025 pm 09:54 PM
Writing code in Visual Studio Code (VSCode) is simple and easy to use. Just install VSCode, create a project, select a language, create a file, write code, save and run it. The advantages of VSCode include cross-platform, free and open source, powerful features, rich extensions, and lightweight and fast.
 How to run python with notepad
Apr 16, 2025 pm 07:33 PM
How to run python with notepad
Apr 16, 2025 pm 07:33 PM
Running Python code in Notepad requires the Python executable and NppExec plug-in to be installed. After installing Python and adding PATH to it, configure the command "python" and the parameter "{CURRENT_DIRECTORY}{FILE_NAME}" in the NppExec plug-in to run Python code in Notepad through the shortcut key "F6".
