
 Web Front-end
JS Tutorial
Detailed explanation of echarts mouse overlay highlighting node and relationship names
Web Front-end
JS Tutorial
Detailed explanation of echarts mouse overlay highlighting node and relationship names
Detailed explanation of echarts mouse overlay highlighting node and relationship names
Below I will share with you a detailed explanation of echarts mouse overlay highlighting of nodes and relationship names. It has a good reference value and I hope it will be helpful to everyone.
This article is modified on the focusNodeAdjacency attribute that comes with echart.
1. Effect
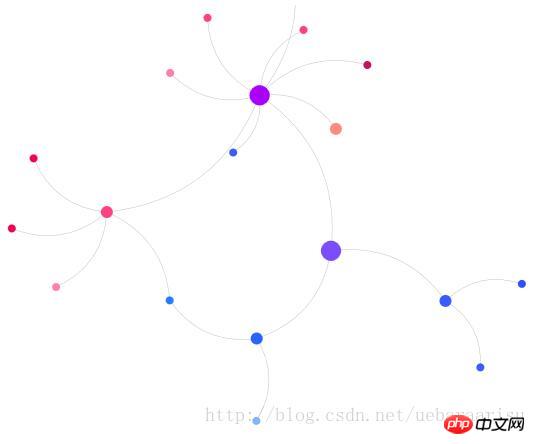
First apply the effect. It turns out that after the mouse overlay, only the node name is displayed but not the relationship name.
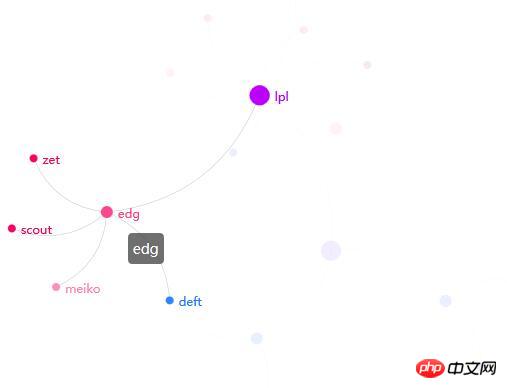
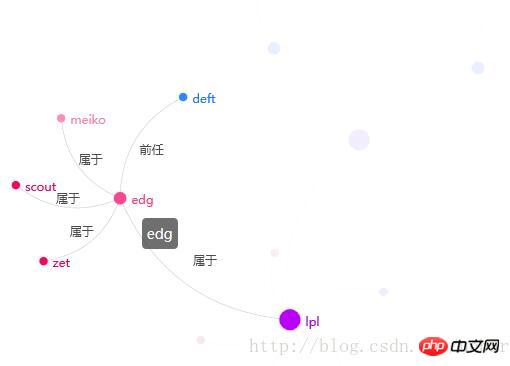
After modification, both node names and (customized) relationship names can be displayed.
2. The code
html part is like this.
js code uses jquery and echarts.js. I use the source code version because I will need it later. Enter the source code and modify it...
echarts.js download address
In fact, the js code is completely the same as the code of the echart official website demo...
For ordinary graph settings, just add focusNodeAdjacency: true.
$(function() {
 showChart();
});
var myChart;
option = {
 title : {
 text : '示例'
 },
 animationDurationUpdate : 1500,
 animationEasingUpdate : 'quinticInOut',
 series : [ {
 type : 'graph',
 layout : 'force',
 //data和edges里的内容在之后动态添加
 data : [],
 edges : [],
 //这个label管的是data的label
 label : {
  emphasis : {
  position : 'right',
  show : true
  }
 },
 force : {
  repulsion : 1000
 },
 roam : true,
 //将指定的节点以及其所有邻接节点高亮。
 focusNodeAdjacency : true,
 lineStyle : {
  normal : {
  width : 0.5,
  curveness : 0.3,
  opacity : 0.7
  }
 },
 draggable : true
 } ]
};
function showChart() {
 myChart = echarts.init(document.getElementById('main'));
 myChart.showLoading();
 $.ajax({
 //我用struts2做了个小后台,这个url就是里面的一个action
 url : 'echartsDisplay',
 type : 'POST',
 data : "{}",
 dataType : 'json',
 success : function(data) {
  myChart.hideLoading();
  //data的结构在下面有截图,可以一一对应
  option.series[0].data = data.nodes.map(function(node) {
  return {
   name : node.name,
   itemStyle : {
   normal : {
    color : node.color
   }
   },
   symbolSize : node.size,
  };
  });
  option.series[0].edges = data.links.map(function(edge) {
  return {
   source : edge.source,
   target : edge.target,
   attribute : edge.value
   //除了api中规定的参数,也可以使用一些自定义的参数,这里的attribute就是自定义的。这个参数在改源码时会用到。
  };
  });
  myChart.setOption(option, true);
 },
 error : function(errorMsg) {
  alert("请求数据失败!");
 }
 });
};The data structure and content returned by the calling interface are as follows:
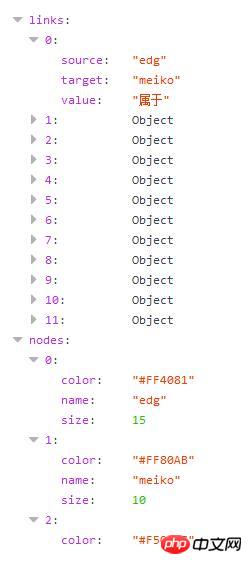
nodes represents nodes, placed in In option.series[0].data.
nodes has three parameters, color represents the color of the node, name is the name (label) of the node, and size is the size of the node.
links represent relationships and are placed in option.series[0].edges.
links has three parameters: source is the starting point of the relationship (bar), target is the end point of the relationship (bar), value is the relationship name (label), which is placed in the attribute parameter in edges.
It should be noted that to achieve this effect, the label parameter must not be set for the relationship in edges.
3. Modify the focusNodeAdjacency method in the source code
I’m ashamed because I didn’t find it in echart’s API that can directly achieve that effect. The only way to do this is to change it in the source code of echarts.
Search focusNodeAdjacency in echarts.js and you will quickly find the following content. Then just add the three lines of code with comments below to achieve the effect of displaying node and relationship names in this article.
focusNodeAdjacency: function (seriesModel, ecModel, api, payload) {
var data = this._model.getData();
var dataIndex = payload.dataIndex;
var el = data.getItemGraphicEl(dataIndex);
if (!el) {
return;
}
var graph = data.graph;
var dataType = el.dataType;
function fadeOutItem(item, opacityPath) {
var opacity = getItemOpacity(item, opacityPath);
var el = item.getGraphicEl();
if (opacity == null) {
opacity = 1;
}
el.traverse(function (child) {
child.trigger('normal');
if (child.type !== 'group') {
child.setStyle('opacity', opacity * 0.1);
}
});
}
function fadeInItem(item, opacityPath) {
var opacity = getItemOpacity(item, opacityPath);
var el = item.getGraphicEl();
el.traverse(function (child) {
child.trigger('emphasis');
/**
* 如果当前child是关系,显示标签,标签内容自定。
* 使用item.getModel().get('xxx'),将xxx修改为对应的参数名称,
* 可获得自带及自定义的所有内容。
* 这里get('attribute')的attribute为edge中自定义的参数。
*/
if(child.type =='ec-line'){
child.setStyle('text',item.getModel().get('attribute'));
}
/**
* 结束,这里就增加上面两句。
*/
if (child.type !== 'group') {
child.setStyle('opacity', opacity);
}
});
}
if (dataIndex !== null && dataType !== 'edge') {
graph.eachNode(function (node) {
fadeOutItem(node, nodeOpacityPath);
});
graph.eachEdge(function (edge) {
fadeOutItem(edge, lineOpacityPath);
});
var node = graph.getNodeByIndex(dataIndex);
fadeInItem(node, nodeOpacityPath);
zrUtil.each(node.edges, function (edge) {
if (edge.dataIndex < 0) {
return;
}
fadeInItem(edge, lineOpacityPath);
fadeInItem(edge.node1, nodeOpacityPath);
fadeInItem(edge.node2, nodeOpacityPath);
});
}
},
unfocusNodeAdjacency: function (seriesModel, ecModel, api, payload) {
var graph = this._model.getData().graph;
graph.eachNode(function (node) {
var opacity = getItemOpacity(node, nodeOpacityPath);
node.getGraphicEl().traverse(function (child) {
child.trigger('normal');
if (child.type !== 'group') {
child.setStyle('opacity', opacity);
}
});
});
graph.eachEdge(function (edge) {
var opacity = getItemOpacity(edge, lineOpacityPath);
edge.getGraphicEl().traverse(function (child) {
child.trigger('normal');
if (child.type !== 'group') {
child.setStyle('opacity', opacity);
/**
* 增加下面这一句话。
* 这个方法是鼠标从节点上移开时调用,取消高亮和标签显示的功能。
* 在这里会把关系的标签清空。
* 所以如果对关系直接设置了label的话,在这一步也会被清掉。
*/
child.setStyle('text','');
}
});
});
},The above is what I compiled for everyone. I hope it will be helpful to everyone in the future.
Related articles:
Instance code of tree-shaped dish implemented by vue
p5.js introductory tutorial keyboard interaction
##
The above is the detailed content of Detailed explanation of echarts mouse overlay highlighting node and relationship names. For more information, please follow other related articles on the PHP Chinese website!

Hot AI Tools

Undresser.AI Undress
AI-powered app for creating realistic nude photos

AI Clothes Remover
Online AI tool for removing clothes from photos.

Undress AI Tool
Undress images for free

Clothoff.io
AI clothes remover

Video Face Swap
Swap faces in any video effortlessly with our completely free AI face swap tool!

Hot Article
Hot Tools

Notepad++7.3.1
Easy-to-use and free code editor

SublimeText3 Chinese version
Chinese version, very easy to use

Zend Studio 13.0.1
Powerful PHP integrated development environment

Dreamweaver CS6
Visual web development tools

SublimeText3 Mac version
God-level code editing software (SublimeText3)
Hot Topics


 Reasons and solutions for desktop layout being locked
Feb 19, 2024 pm 06:08 PM
Reasons and solutions for desktop layout being locked
Feb 19, 2024 pm 06:08 PM
What happens when the desktop layout is locked? When using the computer, sometimes we may encounter the situation where the desktop layout is locked. This problem means that we cannot freely adjust the position of desktop icons or change the desktop background. So, what exactly is going on when it says that the desktop layout is locked? 1. Understand the desktop layout and locking functions. First, we need to understand the two concepts of desktop layout and desktop locking. Desktop layout refers to the arrangement of various elements on the desktop, including shortcuts, folders, widgets, etc. we can be free
 How to use map heat map to display city heat in ECharts
Dec 18, 2023 pm 04:00 PM
How to use map heat map to display city heat in ECharts
Dec 18, 2023 pm 04:00 PM
How to use a map heat map to display city heat in ECharts ECharts is a powerful visual chart library that provides various chart types for developers to use, including map heat maps. Map heat maps can be used to show the popularity of cities or regions, helping us quickly understand the popularity or density of different places. This article will introduce how to use the map heat map in ECharts to display city heat, and provide code examples for reference. First, we need a map file containing geographic information, EC
 How to make a remote desktop connection display the other party's taskbar
Jan 03, 2024 pm 12:49 PM
How to make a remote desktop connection display the other party's taskbar
Jan 03, 2024 pm 12:49 PM
There are many users using Remote Desktop Connection. Many users will encounter some minor problems when using it, such as the other party's taskbar not being displayed. In fact, it is probably a problem with the other party's settings. Let's take a look at the solutions below. How to display the other party's taskbar during Remote Desktop Connection: 1. First, click "Settings". 2. Then open "Personalization". 3. Then select "Taskbar" on the left. 4. Turn off the Hide Taskbar option in the picture.
 How to use histogram to display data in ECharts
Dec 18, 2023 pm 02:21 PM
How to use histogram to display data in ECharts
Dec 18, 2023 pm 02:21 PM
How to use histograms to display data in ECharts ECharts is a JavaScript-based data visualization library that is very popular and widely used in the field of data visualization. Among them, the histogram is the most common and commonly used chart type, which can be used to display the size, comparison and trend analysis of various numerical data. This article will introduce how to use ECharts to draw histograms and provide code examples. First, we need to introduce the ECharts library into the HTML file, which can be introduced in the following way
 Does ECharts depend on jQuery? In-depth analysis
Feb 27, 2024 am 08:39 AM
Does ECharts depend on jQuery? In-depth analysis
Feb 27, 2024 am 08:39 AM
Does ECharts need to rely on jQuery? Detailed interpretation requires specific code examples. ECharts is an excellent data visualization library that provides a rich range of chart types and interactive functions and is widely used in web development. When using ECharts, many people will have a question: Does ECharts need to rely on jQuery? This article will explain this in detail and give specific code examples. First, to be clear, ECharts itself does not rely on jQuery;
 How to use ECharts and php interface to generate statistical charts
Dec 18, 2023 pm 01:47 PM
How to use ECharts and php interface to generate statistical charts
Dec 18, 2023 pm 01:47 PM
How to use ECharts and PHP interfaces to generate statistical charts Introduction: In modern web application development, data visualization is a very important link, which can help us display and analyze data intuitively. ECharts is a powerful open source JavaScript chart library. It provides a variety of chart types and rich interactive functions, and can easily generate various statistical charts. This article will introduce how to use ECharts and PHP interfaces to generate statistical charts, and give specific code examples. 1. Overview of ECha
 How to check the current directory in Linux?
Feb 23, 2024 pm 05:54 PM
How to check the current directory in Linux?
Feb 23, 2024 pm 05:54 PM
In Linux systems, you can use the pwd command to display the current path. The pwd command is the abbreviation of PrintWorkingDirectory and is used to display the path of the current working directory. Enter the following command in the terminal to display the current path: pwd After executing this command, the terminal will display the full path of the current working directory, such as: /home/user/Documents. In addition, you can use some other options to enhance the functionality of the pwd command. For example, the -P option can display
 How to display the wifi password QR code? It is recommended to scan the wifi password on WeChat in 3 seconds.
Feb 20, 2024 pm 01:42 PM
How to display the wifi password QR code? It is recommended to scan the wifi password on WeChat in 3 seconds.
Feb 20, 2024 pm 01:42 PM
You don’t need to enter the WIFI password often, so it’s normal to forget it. Today I will teach you the simplest way to find the password of your own WIFI. It can be done in 3 seconds. To check the WIFI password, use WeChat to scan it. The premise of this method is: there must be a mobile phone that can connect to WIFI. Okay, let’s start the tutorial: Step 1. We enter the phone, pull down from the top of the phone, bring up the status bar, and the WIFI icon. Step 2. Long press the WIFI icon to enter the WLAN settings; long press the WIFI icon. Step 3. Click Connected. Enter the WIFI name of your home, click Share Password, and a QR code will pop up; Step 4 of sharing WIFI password, we take a screenshot and save this QR code; Step 5, long press the WeChat icon on the desktop, and click Scan
