
 Web Front-end
H5 Tutorial
Detailed explanation of endpoints and connection points of line segments in canvas
Web Front-end
H5 Tutorial
Detailed explanation of endpoints and connection points of line segments in canvas
Detailed explanation of endpoints and connection points of line segments in canvas

In Canvas, line segments are also a type of path and are called linear paths. Drawing linear paths in Canvas mainly uses the moveTo(x,y), lineTo(x,y) and stroke() methods. Let us recall the usage of line width.
function drawLine(){
    cxt.lineWidth = 3;
    cxt.moveTo(10, 10);
    cxt.lineTo(120, 100);
    cxt.stroke();
}With the above code we can draw a line segment with a width of 3 pixels.
In the previous chapter, we also mentioned the main content of line width and pixel boundaries:
If you draw a line at the boundary of a certain two pixels 1 pixel wide line segment, then the line segment will actually occupy a width of 2 pixels;
Because when you draw a 1 pixel wide vertical line segment at the pixel boundary, the canvas drawing The environment object will try to draw half a pixel to the right of the center line of the border and the other half to the left of the center line of the border.
However, it is impossible to draw a half-pixel wide line segment within a whole pixel range, so half a pixel in both directions is expanded to 1 pixels. (For specific content, please refer to Chapter 3);
In today’s chapter we will use it to look at other attributes of line segments, lineCap and lineJoin.
Endpoint of line segment (lineCap)
When drawing a line segment, you can control the endpoint of the line segment, which is the "lineCap" (lineCap) ), in the Canvas drawing environment object, the property that controls the endpoints of the line segment is also called lineCap.
The style of the endpoint of the line segment has three values, namely butt, roundm, and square. The default is butt; both round and square will draw a hat on the endpoint of the line segment.
butt: The default style for the endpoints of the line segment
round: Add a A semicircle whose radius is half the linewidth.
#square: Add a rectangle at the endpoint, the length is consistent with the line width, and the width is half the line width.
#It seems that we can’t see anything interesting here. Then let's draw it first, and you will understand it instantly. Otherwise, everyone talks about data visualization!
function lineCap(){
    cxt.lineWidth = 20;
    cxt.strokeStyle = '#16a085';

    cxt.beginPath();
    cxt.lineCap = 'butt';
    cxt.moveTo(20, 20);
    cxt.lineTo(300, 20);
    cxt.stroke();

    cxt.beginPath();
    cxt.lineCap = 'round';
    cxt.moveTo(20, 100);
    cxt.lineTo(300, 100);
    cxt.stroke();

    cxt.beginPath();
    cxt.lineCap = 'square';
    cxt.moveTo(20, 180);
    cxt.lineTo(300, 180);
    cxt.stroke();
}
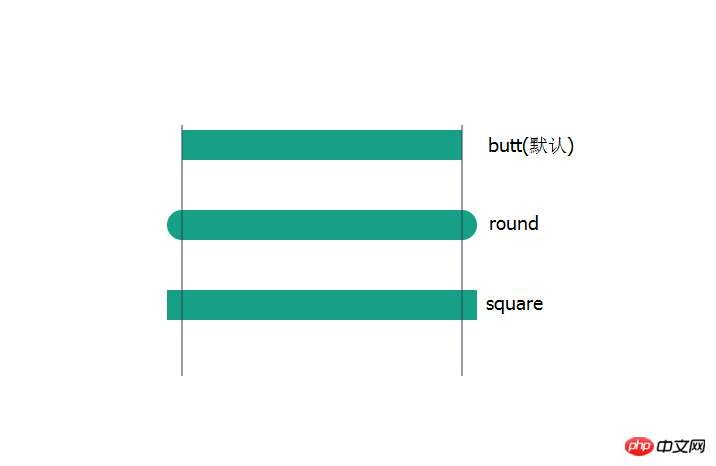
See above Do you instantly know the style of the lineCap attribute value in the picture, and do you also feel the charm of visualization?
The connection point of the line segment (lineJoin)
In When drawing a line segment or rectangle, we can control the inflection point at the connection of two line segments, which is the connection point of the line segments.
In the canvas drawing environment, the connection points of line segments are controlled by the lineJoin attribute.
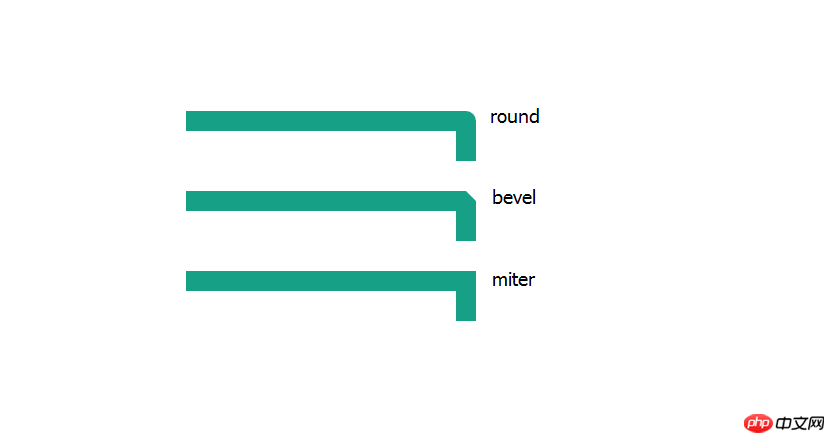
The lineJoin attribute also has three values: round, bevel, miter. The default is miter.
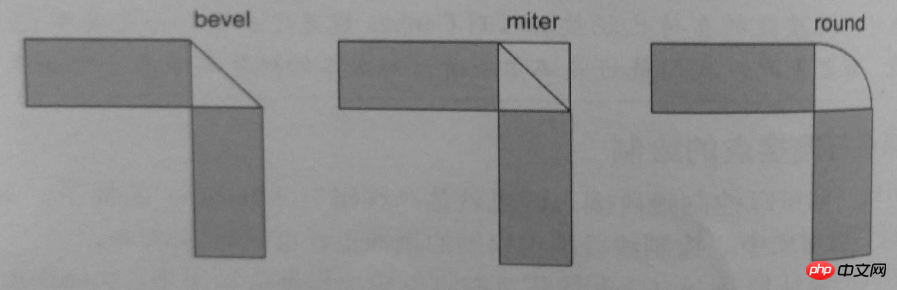
round: Fill in an additional arc. The arc is formed by connecting the outer edge points of the corners of two line segments with arcs.
bevel: Fill in an additional triangle. The triangle is formed by connecting the outer edge points of the corners of two line segments with a straight line.
miter: Fill an additional polygon, which is formed by the intersection of the extension lines of the outer edges of the corners of the two line segments.
Let’s draw it and take a look
function lineCap(){
    cxt.lineWidth = 20;
    cxt.strokeStyle = '#16a085';

    cxt.beginPath();
    cxt.lineJoin = 'round';
    cxt.moveTo(20, 20);
    cxt.lineTo(300, 20);
    cxt.lineTo(300, 60);
    cxt.stroke();

    cxt.beginPath();
    cxt.lineJoin = 'bevel';
    cxt.moveTo(20, 100);
    cxt.lineTo(300, 100);
    cxt.lineTo(300, 140);
    cxt.stroke();

    cxt.beginPath();
    cxt.lineJoin = 'miter';
    cxt.moveTo(20, 180);
    cxt.lineTo(300, 180);
    cxt.lineTo(300, 220);
    cxt.stroke();
}
Let’s take a look at the specific construction method of line segment connection points
## Tips
When we use the miter style to draw the connection of line segments When clicking, we can also specify a miterLimit attribute
miterLimit: represents the ratio of the length of the miter line (miter) to half the line width;
The measurement method of oblique line is as follows
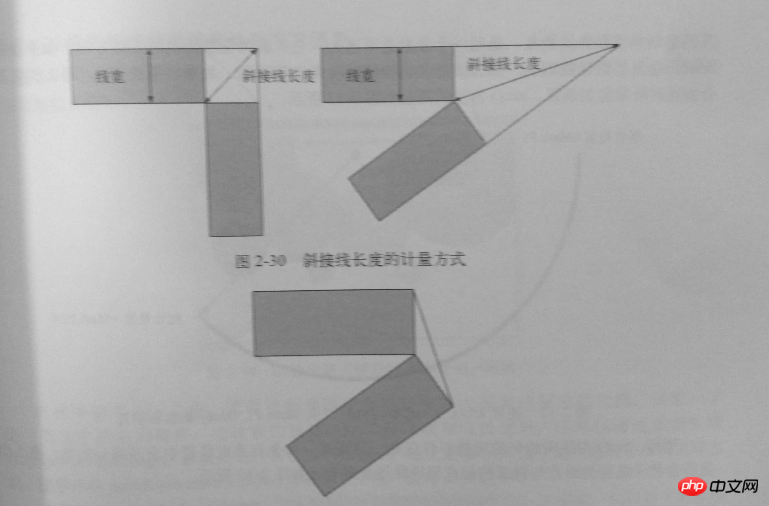
At this time, the browser will draw the connection points of the line segments in a bevel manner.
Summary##Related properties of line segments in the Canvas drawing environment
| Description | Value | Default value | |
| Line segment width in pixels | Non-zero positive number | 1 | |
| Endpoint style for drawing line segments | butt, round , square | butt | |
| line segment connection point Style | bevel, round, miter | miter | ##miterLimit |
| The ratio of the diagonal line to one-half line width | A non-zero positive number | 10 |
The above is the detailed content of Detailed explanation of endpoints and connection points of line segments in canvas. For more information, please follow other related articles on the PHP Chinese website!

Hot AI Tools

Undresser.AI Undress
AI-powered app for creating realistic nude photos

AI Clothes Remover
Online AI tool for removing clothes from photos.

Undress AI Tool
Undress images for free

Clothoff.io
AI clothes remover

Video Face Swap
Swap faces in any video effortlessly with our completely free AI face swap tool!

Hot Article
Hot Tools

Notepad++7.3.1
Easy-to-use and free code editor

SublimeText3 Chinese version
Chinese version, very easy to use

Zend Studio 13.0.1
Powerful PHP integrated development environment

Dreamweaver CS6
Visual web development tools

SublimeText3 Mac version
God-level code editing software (SublimeText3)
Hot Topics


 Which schools use canvas?
Aug 18, 2023 pm 05:59 PM
Which schools use canvas?
Aug 18, 2023 pm 05:59 PM
Schools using canvas include Stanford University, MIT, Columbia University, University of California, Berkeley, etc. Detailed introduction: 1. Stanford University uses Canvas as its main online learning platform. Teachers and students at Stanford University use Canvas to manage and communicate course content, and learn through functions such as online discussions, assignment submissions, and exams; 2. Ma Provincial Polytechnic Institute and MIT also use Canvas as their online learning management system and conduct course management through the Canvas platform; 3. Columbia University, etc.
 What are the canvas arrow plug-ins?
Aug 21, 2023 pm 02:14 PM
What are the canvas arrow plug-ins?
Aug 21, 2023 pm 02:14 PM
The canvas arrow plug-ins include: 1. Fabric.js, which has a simple and easy-to-use API and can create custom arrow effects; 2. Konva.js, which provides the function of drawing arrows and can create various arrow styles; 3. Pixi.js , which provides rich graphics processing functions and can achieve various arrow effects; 4. Two.js, which can easily create and control arrow styles and animations; 5. Arrow.js, which can create various arrow effects; 6. Rough .js, you can create hand-drawn arrows, etc.
 Learn the canvas framework and explain the commonly used canvas framework in detail
Jan 17, 2024 am 11:03 AM
Learn the canvas framework and explain the commonly used canvas framework in detail
Jan 17, 2024 am 11:03 AM
Explore the Canvas framework: To understand what are the commonly used Canvas frameworks, specific code examples are required. Introduction: Canvas is a drawing API provided in HTML5, through which we can achieve rich graphics and animation effects. In order to improve the efficiency and convenience of drawing, many developers have developed different Canvas frameworks. This article will introduce some commonly used Canvas frameworks and provide specific code examples to help readers gain a deeper understanding of how to use these frameworks. 1. EaselJS framework Ea
 What are the details of the canvas clock?
Aug 21, 2023 pm 05:07 PM
What are the details of the canvas clock?
Aug 21, 2023 pm 05:07 PM
The details of the canvas clock include clock appearance, tick marks, digital clock, hour, minute and second hands, center point, animation effects, other styles, etc. Detailed introduction: 1. Clock appearance, you can use Canvas to draw a circular dial as the appearance of the clock, and you can set the size, color, border and other styles of the dial; 2. Scale lines, draw scale lines on the dial to represent hours or minutes. Position; 3. Digital clock, you can draw a digital clock on the dial to indicate the current hour and minute; 4. Hour hand, minute hand, second hand, etc.
 What versions of html2canvas are there?
Aug 22, 2023 pm 05:58 PM
What versions of html2canvas are there?
Aug 22, 2023 pm 05:58 PM
The versions of html2canvas include html2canvas v0.x, html2canvas v1.x, etc. Detailed introduction: 1. html2canvas v0.x, which is an early version of html2canvas. The latest stable version is v0.5.0-alpha1. It is a mature version that has been widely used and verified in many projects; 2. html2canvas v1.x, this is a new version of html2canvas.
 uniapp implements how to use canvas to draw charts and animation effects
Oct 18, 2023 am 10:42 AM
uniapp implements how to use canvas to draw charts and animation effects
Oct 18, 2023 am 10:42 AM
How to use canvas to draw charts and animation effects in uniapp requires specific code examples 1. Introduction With the popularity of mobile devices, more and more applications need to display various charts and animation effects on the mobile terminal. As a cross-platform development framework based on Vue.js, uniapp provides the ability to use canvas to draw charts and animation effects. This article will introduce how uniapp uses canvas to achieve chart and animation effects, and give specific code examples. 2. canvas
 What properties does tkinter canvas have?
Aug 21, 2023 pm 05:46 PM
What properties does tkinter canvas have?
Aug 21, 2023 pm 05:46 PM
The tkinter canvas attributes include bg, bd, relief, width, height, cursor, highlightbackground, highlightcolor, highlightthickness, insertbackground, insertwidth, selectbackground, selectforeground, xscrollcommand attributes, etc. Detailed introduction
 Where are the canvas mouse coordinates?
Aug 22, 2023 pm 03:08 PM
Where are the canvas mouse coordinates?
Aug 22, 2023 pm 03:08 PM
How to get mouse coordinates for canvas: 1. Create a JavaScript sample file; 2. Get a reference to the Canvas element and add a listener for mouse movement events; 3. When the mouse moves on the Canvas, the getMousePos function will be triggered; 4. Use The "getBoundingClientRect()" method obtains the position and size information of the Canvas element, and obtains the mouse coordinates through event.clientX and event.clientY.
