
 Backend Development
Python Tutorial
matplotlib draws pictures that meet the requirements of the paper
Backend Development
Python Tutorial
matplotlib draws pictures that meet the requirements of the paper
matplotlib draws pictures that meet the requirements of the paper
最近需要将实验数据画图出来,由于使用python进行实验,自然使用到了matplotlib来作图。
下面的代码可以作为画图的模板代码,代码中有详细注释,可根据需要进行更改。
1 # -*- coding: utf-8 -*- 2 import numpy as np 3 import matplotlib.pyplot as plt 4 plt.rcParams['font.sans-serif']=['Arial'] #如果要显示中文字体,则在此处设为:SimHei 5 plt.rcParams['axes.unicode_minus']=False #显示负号 6 7 x = np.array([3,5,7,9,11,13,15,17,19,21]) 8 A = np.array([0.9708, 0.6429, 1, 0.8333, 0.8841, 0.5867, 0.9352, 0.8000, 0.9359, 0.9405]) 9 B= np.array([0.9708, 0.6558, 1, 0.8095, 0.8913, 0.5950, 0.9352, 0.8000, 0.9359, 0.9419])10 C=np.array([0.9657, 0.6688, 0.9855, 0.7881, 0.8667, 0.5952, 0.9361, 0.7848, 0.9244, 0.9221])11 D=np.array([0.9664, 0.6701, 0.9884, 0.7929, 0.8790, 0.6072, 0.9352, 0.7920, 0.9170, 0.9254])12 13 #label在图示(legend)中显示。若为数学公式,则最好在字符串前后添加"$"符号14 #color:b:blue、g:green、r:red、c:cyan、m:magenta、y:yellow、k:black、w:white、、、15 #线型:- -- -. : , 16 #marker:. , o v < * + 117 plt.figure(figsize=(10,5))18 plt.grid(linestyle = "--") #设置背景网格线为虚线19 ax = plt.gca()20 ax.spines['top'].set_visible(False) #去掉上边框21 ax.spines['right'].set_visible(False) #去掉右边框22 23 plt.plot(x,A,color="black",label="A algorithm",linewidth=1.5)24 plt.plot(x,B,"k--",label="B algorithm",linewidth=1.5)25 plt.plot(x,C,color="red",label="C algorithm",linewidth=1.5)26 plt.plot(x,D,"r--",label="D algorithm",linewidth=1.5)27 28 group_labels=['dataset1','dataset2','dataset3','dataset4','dataset5',' dataset6','dataset7','dataset8','dataset9','dataset10'] #x轴刻度的标识29 plt.xticks(x,group_labels,fontsize=12,fontweight='bold') #默认字体大小为1030 plt.yticks(fontsize=12,fontweight='bold')31 plt.title("example",fontsize=12,fontweight='bold') #默认字体大小为1232 plt.xlabel("Data sets",fontsize=13,fontweight='bold')33 plt.ylabel("Accuracy",fontsize=13,fontweight='bold')34 plt.xlim(3,21) #设置x轴的范围35 #plt.ylim(0.5,1)36 37 #plt.legend() #显示各曲线的图例38 plt.legend(loc=0, numpoints=1)39 leg = plt.gca().get_legend()40 ltext = leg.get_texts()41 plt.setp(ltext, fontsize=12,fontweight='bold') #设置图例字体的大小和粗细42 43 plt.savefig('D:\\filename.svg',format='svg') #建议保存为svg格式,再用inkscape转为矢量图emf后插入word中44 plt.show()下面是上面代码绘制的图例:

建议保存图片的格式svg(因为matplotlib存为eps矢量图时候会有问题),然后使用inkscape软件将svg格式转为emf矢量图格式。如果svg图片很多,可以在windows下使用批处理(安装inkscape软件后要记得设置path路径),下面这段代码能将它所在目录下的svg文件转为emf文件。将下面代码复制到文本文件,改后缀名为bat。
1 @echo off2 for %%i in (*.svg) do (3 echo %%i4 inkscape -f %%i -M %%~ni.emf5 )6 @echo Finished
The above is the detailed content of matplotlib draws pictures that meet the requirements of the paper. For more information, please follow other related articles on the PHP Chinese website!

Hot AI Tools

Undresser.AI Undress
AI-powered app for creating realistic nude photos

AI Clothes Remover
Online AI tool for removing clothes from photos.

Undress AI Tool
Undress images for free

Clothoff.io
AI clothes remover

Video Face Swap
Swap faces in any video effortlessly with our completely free AI face swap tool!

Hot Article
Hot Tools

Notepad++7.3.1
Easy-to-use and free code editor

SublimeText3 Chinese version
Chinese version, very easy to use

Zend Studio 13.0.1
Powerful PHP integrated development environment

Dreamweaver CS6
Visual web development tools

SublimeText3 Mac version
God-level code editing software (SublimeText3)
Hot Topics
 1672
1672
 14
1428
52
1332
25
1277
29
1257
24
14
1428
52
1332
25
1277
29
1257
24

 The Stable Diffusion 3 paper is finally released, and the architectural details are revealed. Will it help to reproduce Sora?
Mar 06, 2024 pm 05:34 PM
The Stable Diffusion 3 paper is finally released, and the architectural details are revealed. Will it help to reproduce Sora?
Mar 06, 2024 pm 05:34 PM
StableDiffusion3’s paper is finally here! This model was released two weeks ago and uses the same DiT (DiffusionTransformer) architecture as Sora. It caused quite a stir once it was released. Compared with the previous version, the quality of the images generated by StableDiffusion3 has been significantly improved. It now supports multi-theme prompts, and the text writing effect has also been improved, and garbled characters no longer appear. StabilityAI pointed out that StableDiffusion3 is a series of models with parameter sizes ranging from 800M to 8B. This parameter range means that the model can be run directly on many portable devices, significantly reducing the use of AI
 ICCV'23 paper award 'Fighting of Gods'! Meta Divide Everything and ControlNet were jointly selected, and there was another article that surprised the judges
Oct 04, 2023 pm 08:37 PM
ICCV'23 paper award 'Fighting of Gods'! Meta Divide Everything and ControlNet were jointly selected, and there was another article that surprised the judges
Oct 04, 2023 pm 08:37 PM
ICCV2023, the top computer vision conference held in Paris, France, has just ended! This year's best paper award is simply a "fight between gods". For example, the two papers that won the Best Paper Award included ControlNet, a work that subverted the field of Vincentian graph AI. Since being open sourced, ControlNet has received 24k stars on GitHub. Whether it is for diffusion models or the entire field of computer vision, this paper's award is well-deserved. The honorable mention for the best paper award was awarded to another equally famous paper, Meta's "Separate Everything" ”Model SAM. Since its launch, "Segment Everything" has become the "benchmark" for various image segmentation AI models, including those that came from behind.
 Can the floor plan be drawn directly in architectural ppt?
Mar 20, 2024 am 08:43 AM
Can the floor plan be drawn directly in architectural ppt?
Mar 20, 2024 am 08:43 AM
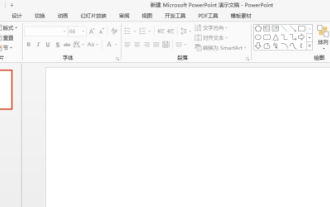
ppt is widely used in many fields and work, especially in education, architecture, etc. When it comes to architectural ppt, we must first think of the presentation of some architectural drawings. If we do not use professional drawing software, can we directly draw a simple architectural plan? In fact, we can complete the operation here. Below, we will draw a relatively simple floor plan to give you an idea. I hope you can complete better floor plan drawings based on this idea. 1. First, we double-click to open the ppt software on the desktop and click to create a new presentation blank document. 2. We find Insert→Shape→Rectangle in the menu bar. 3. After drawing the rectangle, double-click the graphic and modify the fill color type. Here we can modify
 A deep dive into matplotlib's colormap
Jan 09, 2024 pm 03:51 PM
A deep dive into matplotlib's colormap
Jan 09, 2024 pm 03:51 PM
To learn more about the matplotlib color table, you need specific code examples 1. Introduction matplotlib is a powerful Python drawing library. It provides a rich set of drawing functions and tools that can be used to create various types of charts. The colormap (colormap) is an important concept in matplotlib, which determines the color scheme of the chart. In-depth study of the matplotlib color table will help us better master the drawing functions of matplotlib and make drawings more convenient.
 How to install Matplotlib in pycharm
Dec 18, 2023 pm 04:32 PM
How to install Matplotlib in pycharm
Dec 18, 2023 pm 04:32 PM
Installation steps: 1. Open the PyCharm integrated development environment; 2. Go to the "File" menu and select "Settings"; 3. In the "Settings" dialog box, select "Python Interpreter" under "Project: <your_project_name>" ; 4. Click the plus button "+" in the upper right corner and search for "matplotlib" in the pop-up dialog box; 5. Select "matplotlib" to install.
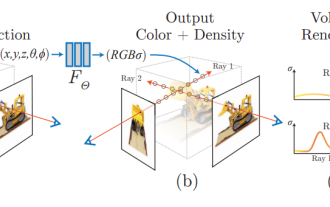 NeRF and the past and present of autonomous driving, a summary of nearly 10 papers!
Nov 14, 2023 pm 03:09 PM
NeRF and the past and present of autonomous driving, a summary of nearly 10 papers!
Nov 14, 2023 pm 03:09 PM
Since Neural Radiance Fields was proposed in 2020, the number of related papers has increased exponentially. It has not only become an important branch of three-dimensional reconstruction, but has also gradually become active at the research frontier as an important tool for autonomous driving. NeRF has suddenly emerged in the past two years, mainly because it skips the feature point extraction and matching, epipolar geometry and triangulation, PnP plus Bundle Adjustment and other steps of the traditional CV reconstruction pipeline, and even skips mesh reconstruction, mapping and light tracing, directly from 2D The input image is used to learn a radiation field, and then a rendered image that approximates a real photo is output from the radiation field. In other words, let an implicit three-dimensional model based on a neural network fit the specified perspective
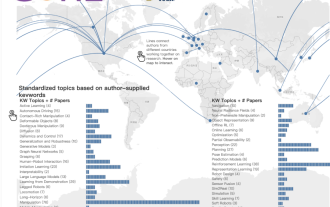 The Chinese team won the best paper and best system paper awards, and the CoRL research results were announced.
Nov 10, 2023 pm 02:21 PM
The Chinese team won the best paper and best system paper awards, and the CoRL research results were announced.
Nov 10, 2023 pm 02:21 PM
Since it was first held in 2017, CoRL has become one of the world's top academic conferences in the intersection of robotics and machine learning. CoRL is a single-theme conference for robot learning research, covering multiple topics such as robotics, machine learning and control, including theory and application. The 2023 CoRL Conference will be held in Atlanta, USA, from November 6th to 9th. According to official data, 199 papers from 25 countries were selected for CoRL this year. Popular topics include operations, reinforcement learning, and more. Although CoRL is smaller in scale than large AI academic conferences such as AAAI and CVPR, as the popularity of concepts such as large models, embodied intelligence, and humanoid robots increases this year, relevant research worthy of attention will also
 How to draw lines with arrows in OpenCV using Java?
Aug 20, 2023 pm 02:41 PM
How to draw lines with arrows in OpenCV using Java?
Aug 20, 2023 pm 02:41 PM
The org.opencv.imgproc package of the JavaOpenCV library contains a class called Imgproc that provides various methods to process input images. It provides a set of methods for drawing geometric shapes on images. To draw an arrowed line, you need to call the arrowedLine() method of this class. The method accepts the following parameters: a Mat object representing the image on which the line is to be drawn. A Point object representing two points between lines. drawn. A Scalar object representing the line color. (BGR) An integer representing the thickness of the line (default: 1). Example importorg.opencv.core.Core;importo
