Summary of using Python to draw charts
This article mainly introduces a comprehensive summary of using Python to draw charts. The editor thinks it is quite good. Now I will share it with you and give it as a reference. Let’s follow the editor and take a look.
Before using Python to draw charts, we need to install two library files, numpy and matplotlib.
Numpy is an open source numerical computing extension for Python, which can be used to store and process large matrices and is more efficient than Python's own data structure; matplotlib is a Python image framework, using its graphic effects and drawing under MATLAB The graphics are similar.
Below I will introduce how to use Python to draw through some simple code.
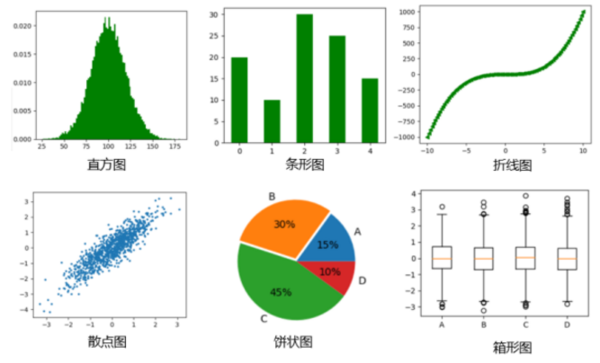
1. Graphic drawing

importmatplotlib.pyplotasplt

importnumpyasnp

mu=100

sigma=20

x=mu+sigma*np.random.randn(20000)# 样本数量

plt.hist(x,bins=100,color='green',normed=True)# bins显示有几个直方,normed是否对数据进行标准化

plt.show()
importmatplotlib.pyplotasplt

importnumpyasnp

y=[20,10,30,25,15]

index=np.arange(5)

plt.bar(left=index,height=y,color='green',width=0.5)

plt.show()
importmatplotlib.pyplotasplt importnumpyasnp x=np.linspace(-10,10,100) y=x**3 plt.plot(x,y,linestyle='--',color='green',marker='<') plt.show()
importmatplotlib.pyplotasplt importnumpyasnp x=np.random.randn(1000) y=x+np.random.randn(1000)*0.5 plt.scatter(x,y,s=5,marker='<')# s表示面积,marker表示图形 plt.show()
importmatplotlib.pyplotasplt

importnumpyasnp

labels='A','B','C','D'

fracs=[15,30,45,10]

plt.axes(aspect=1)#使x y轴比例相同

explode=[0,0.05,0,0]# 突出某一部分区域

plt.pie(x=fracs,labels=labels,autopct='%.0f%%',explode=explode)#autopct显示百分比

plt.show()
importmatplotlib.pyplotasplt

importnumpyasnp

np.random.seed(100)

data=np.random.normal(size=(1000,4),loc=0,scale=1)

labels=['A','B','C','D']

plt.boxplot(data,labels=labels)

plt.show()
2. Image adjustment
1. 23 point shapes"."point","pixel"o"circle"v"triangle_down "^"triangle_up"<"triangle_left">"triangle_right"1"tri_down "2"tri_up"3"tri_left"4"tri_right"8"octagon "s"square"p"pentagon"*"star"h"hexagon1"H"hexagon2 "+"plus"x"x"D"diamond"d"thin_diamond
b:blueg:greenr:redc:cyan

m:magentay:yellowk:blackw:white

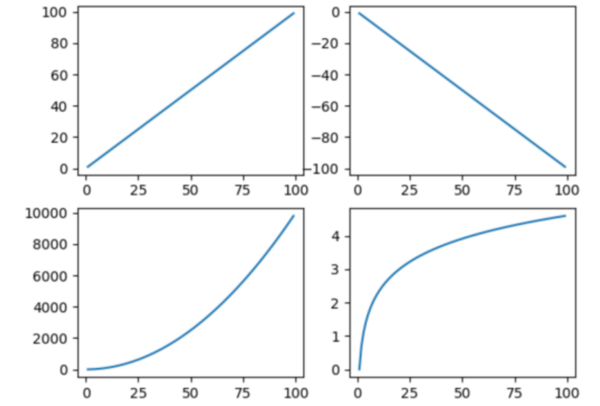
importmatplotlib.pyplotasplt

importnumpyasnp

x=np.arange(1,100)

plt.subplot(221)#2行2列第1个图

plt.plot(x,x)

plt.subplot(222)

plt.plot(x,-x)

plt.subplot(223)

plt.plot(x,x*x)

plt.subplot(224)

plt.plot(x,np.log(x))

plt.show()

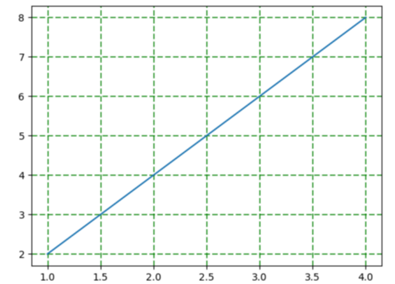
importmatplotlib.pyplotasplt

importnumpyasnp

y=np.arange(1,5)

plt.plot(y,y*2)

plt.grid(True,color='g',linestyle='--',linewidth='1')

plt.show()
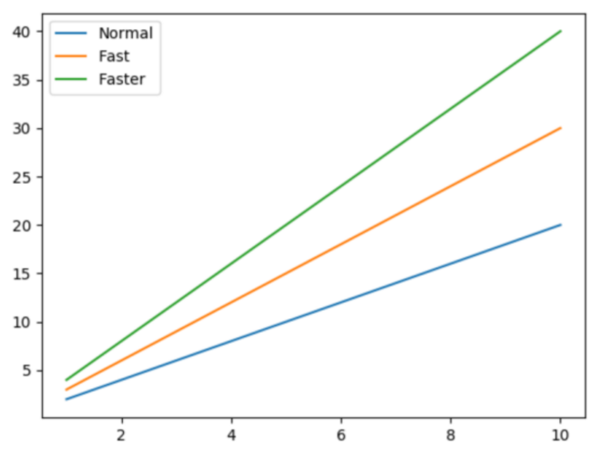
6. Generate legend

importmatplotlib.pyplotasplt

importnumpyasnp

x=np.arange(1,11,1)

plt.plot(x,x*2)

plt.plot(x,x*3)

plt.plot(x,x*4)

plt.legend(['Normal','Fast','Faster'])

plt.show()

Hot AI Tools

Undresser.AI Undress
AI-powered app for creating realistic nude photos

AI Clothes Remover
Online AI tool for removing clothes from photos.

Undress AI Tool
Undress images for free

Clothoff.io
AI clothes remover

Video Face Swap
Swap faces in any video effortlessly with our completely free AI face swap tool!

Hot Article

Hot Tools

Notepad++7.3.1
Easy-to-use and free code editor

SublimeText3 Chinese version
Chinese version, very easy to use

Zend Studio 13.0.1
Powerful PHP integrated development environment

Dreamweaver CS6
Visual web development tools

SublimeText3 Mac version
God-level code editing software (SublimeText3)

Hot Topics
 1671
1671
 14
14
 1428
1428
 52
52
 1331
1331
 25
25
 1276
1276
 29
29
 1256
1256
 24
24
 Python vs. C : Learning Curves and Ease of Use
Apr 19, 2025 am 12:20 AM
Python is easier to learn and use, while C is more powerful but complex. 1. Python syntax is concise and suitable for beginners. Dynamic typing and automatic memory management make it easy to use, but may cause runtime errors. 2.C provides low-level control and advanced features, suitable for high-performance applications, but has a high learning threshold and requires manual memory and type safety management.
 Python and Time: Making the Most of Your Study Time
Apr 14, 2025 am 12:02 AM
To maximize the efficiency of learning Python in a limited time, you can use Python's datetime, time, and schedule modules. 1. The datetime module is used to record and plan learning time. 2. The time module helps to set study and rest time. 3. The schedule module automatically arranges weekly learning tasks.
 Python vs. C : Exploring Performance and Efficiency
Apr 18, 2025 am 12:20 AM
Python is better than C in development efficiency, but C is higher in execution performance. 1. Python's concise syntax and rich libraries improve development efficiency. 2.C's compilation-type characteristics and hardware control improve execution performance. When making a choice, you need to weigh the development speed and execution efficiency based on project needs.
 Learning Python: Is 2 Hours of Daily Study Sufficient?
Apr 18, 2025 am 12:22 AM
Is it enough to learn Python for two hours a day? It depends on your goals and learning methods. 1) Develop a clear learning plan, 2) Select appropriate learning resources and methods, 3) Practice and review and consolidate hands-on practice and review and consolidate, and you can gradually master the basic knowledge and advanced functions of Python during this period.
 Python vs. C : Understanding the Key Differences
Apr 21, 2025 am 12:18 AM
Python and C each have their own advantages, and the choice should be based on project requirements. 1) Python is suitable for rapid development and data processing due to its concise syntax and dynamic typing. 2)C is suitable for high performance and system programming due to its static typing and manual memory management.
 Which is part of the Python standard library: lists or arrays?
Apr 27, 2025 am 12:03 AM
Pythonlistsarepartofthestandardlibrary,whilearraysarenot.Listsarebuilt-in,versatile,andusedforstoringcollections,whereasarraysareprovidedbythearraymoduleandlesscommonlyusedduetolimitedfunctionality.
 Python: Automation, Scripting, and Task Management
Apr 16, 2025 am 12:14 AM
Python excels in automation, scripting, and task management. 1) Automation: File backup is realized through standard libraries such as os and shutil. 2) Script writing: Use the psutil library to monitor system resources. 3) Task management: Use the schedule library to schedule tasks. Python's ease of use and rich library support makes it the preferred tool in these areas.
 Python for Scientific Computing: A Detailed Look
Apr 19, 2025 am 12:15 AM
Python's applications in scientific computing include data analysis, machine learning, numerical simulation and visualization. 1.Numpy provides efficient multi-dimensional arrays and mathematical functions. 2. SciPy extends Numpy functionality and provides optimization and linear algebra tools. 3. Pandas is used for data processing and analysis. 4.Matplotlib is used to generate various graphs and visual results.


