

Excel TREND function and other ways to do trend analysis

This tutorial demonstrates how to calculate trends in Excel using the TREND function, create trendlines on charts, and explore alternative methods. In today's rapidly evolving technological, market, and customer landscapes, understanding trends is crucial. Trend analysis helps identify patterns in past and present data to predict future behavior.
- Using the TREND function: formula examples
- Trendline analysis using historical data
- Projecting future trends
- Trend formulas with multiple x-value sets
- Alternative trend analysis methods in Excel
- FORECAST vs. TREND
- Trendline charts and equations
- Moving averages
The Excel TREND Function
The TREND function calculates a linear trendline through a set of dependent y-values and optional independent x-values, returning values along this line. It can also project the trendline into the future, predicting y-values for new x-values.
The TREND function's syntax is:
TREND(known_y's, [known_x's], [new_x's], [const])
Where:
- known_y's (required): Your known dependent y-values.
- known_x's (optional): One or more sets of independent x-values. If omitted, it defaults to {1,2,3,...}. Rules for dimensions apply depending on the number of x-value sets.
- new_x's (optional): New x-values for trend projection. Must have the same dimensions as known_x's if provided. If omitted, it equals known_x's.
- const (optional): A logical value (TRUE/FALSE) determining how the constant 'a' in the equation y = bx a is calculated. TRUE (or omitted) calculates 'a' normally; FALSE forces 'a' to 0.
TREND Function and Linear Trendline Calculation
The TREND function uses the least squares method to find the best-fitting line. The equation is:
For one x-value set: y = bx a
For multiple x-value sets: y = b1x1 b2x2 … bnxn a
Where:
- y is the dependent variable.
- x is the independent variable.
- a is the y-intercept.
- b is the slope.
This is the same equation used by the LINEST function and linear regression.
TREND as an Array Formula
To return multiple new y-values, use TREND as an array formula (select the output range, enter the formula, and press Ctrl Shift Enter). The resulting curly braces {} indicate an array formula. Individual cells within the array cannot be edited.
Excel TREND Formula Examples
Let's illustrate with examples.
Time Series Trend Analysis with TREND
Assume you have month numbers (x-values) in A2:A13 and sales figures (y-values) in B2:B13. To find the overall trend:
Select C2:C13, enter =TREND(B2:B13,A2:A13), and press Ctrl Shift Enter. Create a line chart using B1:C13 to visualize the trendline.

Projecting Future Trends
Extend the time series with new month numbers (A14:A17) and project the trend using:
=TREND(B2:B13,A2:A13,A14:A17)
(Enter in C14:C17, Ctrl Shift Enter). Create a chart with B1:C17.

Multiple X-Value Sets
With known_x1 in B2:B13, known_x2 in C2:C13, and known_y in D2:D13, the trend is:
=TREND(D2:D13,B2:C13)
Projecting with new_x1 in B14:B17 and new_x2 in C14:C17:
=TREND(D2:D13,B2:C13,B14:C17)

Alternative Trend Analysis Methods
While TREND is popular, other methods exist.
FORECAST vs. TREND
While similar, "trend" describes past/present data, while "forecast" predicts the future. In Excel, TREND can do both, but FORECAST only predicts future values. FORECAST is a regular formula (single output), while TREND is an array formula (multiple outputs). For linear time series, they produce identical results.
Compare: =TREND(B2:B13,A2:A13,A14:A17) and =FORECAST(A14,$B$2:$B$13,$A$2:$A$13)

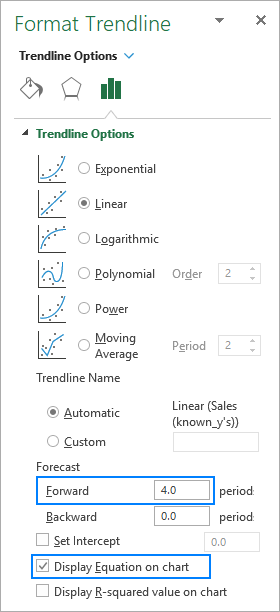
Trendlines on Charts
Add a trendline to a chart by right-clicking the data series, selecting "Add Trendline...", and choosing a type. The "Format Trendline" pane allows forecasting and displaying the equation.

Moving Averages
Moving averages smooth short-term fluctuations to highlight longer-term trends. Add a moving average trendline on a chart via the "Add Trendline..." option.

This tutorial covers using the TREND function for trend analysis in Excel. For a closer look at the examples, download the sample workbook.
The above is the detailed content of Excel TREND function and other ways to do trend analysis. For more information, please follow other related articles on the PHP Chinese website!

Hot AI Tools

Undresser.AI Undress
AI-powered app for creating realistic nude photos

AI Clothes Remover
Online AI tool for removing clothes from photos.

Undress AI Tool
Undress images for free

Clothoff.io
AI clothes remover

Video Face Swap
Swap faces in any video effortlessly with our completely free AI face swap tool!

Hot Article
Hot Tools

Notepad++7.3.1
Easy-to-use and free code editor

SublimeText3 Chinese version
Chinese version, very easy to use

Zend Studio 13.0.1
Powerful PHP integrated development environment

Dreamweaver CS6
Visual web development tools

SublimeText3 Mac version
God-level code editing software (SublimeText3)
Hot Topics
 1653
1653
 14
1413
52
1304
25
1251
29
1224
24
14
1413
52
1304
25
1251
29
1224
24

 How to add calendar to Outlook: shared, Internet calendar, iCal file
Apr 03, 2025 am 09:06 AM
How to add calendar to Outlook: shared, Internet calendar, iCal file
Apr 03, 2025 am 09:06 AM
This article explains how to access and utilize shared calendars within the Outlook desktop application, including importing iCalendar files. Previously, we covered sharing your Outlook calendar. Now, let's explore how to view calendars shared with
 How to use Flash Fill in Excel with examples
Apr 05, 2025 am 09:15 AM
How to use Flash Fill in Excel with examples
Apr 05, 2025 am 09:15 AM
This tutorial provides a comprehensive guide to Excel's Flash Fill feature, a powerful tool for automating data entry tasks. It covers various aspects, from its definition and location to advanced usage and troubleshooting. Understanding Excel's Fla
 MEDIAN formula in Excel - practical examples
Apr 11, 2025 pm 12:08 PM
MEDIAN formula in Excel - practical examples
Apr 11, 2025 pm 12:08 PM
This tutorial explains how to calculate the median of numerical data in Excel using the MEDIAN function. The median, a key measure of central tendency, identifies the middle value in a dataset, offering a more robust representation of central tenden
 Excel shared workbook: How to share Excel file for multiple users
Apr 11, 2025 am 11:58 AM
Excel shared workbook: How to share Excel file for multiple users
Apr 11, 2025 am 11:58 AM
This tutorial provides a comprehensive guide to sharing Excel workbooks, covering various methods, access control, and conflict resolution. Modern Excel versions (2010, 2013, 2016, and later) simplify collaborative editing, eliminating the need to m
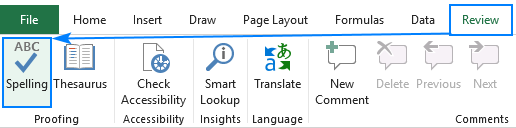 How to spell check in Excel
Apr 06, 2025 am 09:10 AM
How to spell check in Excel
Apr 06, 2025 am 09:10 AM
This tutorial demonstrates various methods for spell-checking in Excel: manual checks, VBA macros, and using a specialized tool. Learn to check spelling in cells, ranges, worksheets, and entire workbooks. While Excel isn't a word processor, its spel
 Excel: Group rows automatically or manually, collapse and expand rows
Apr 08, 2025 am 11:17 AM
Excel: Group rows automatically or manually, collapse and expand rows
Apr 08, 2025 am 11:17 AM
This tutorial demonstrates how to streamline complex Excel spreadsheets by grouping rows, making data easier to analyze. Learn to quickly hide or show row groups and collapse the entire outline to a specific level. Large, detailed spreadsheets can be
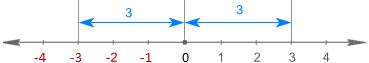 Absolute value in Excel: ABS function with formula examples
Apr 06, 2025 am 09:12 AM
Absolute value in Excel: ABS function with formula examples
Apr 06, 2025 am 09:12 AM
This tutorial explains the concept of absolute value and demonstrates practical Excel applications of the ABS function for calculating absolute values within datasets. Numbers can be positive or negative, but sometimes only positive values are neede
 Google Spreadsheet COUNTIF function with formula examples
Apr 11, 2025 pm 12:03 PM
Google Spreadsheet COUNTIF function with formula examples
Apr 11, 2025 pm 12:03 PM
Master Google Sheets COUNTIF: A Comprehensive Guide This guide explores the versatile COUNTIF function in Google Sheets, demonstrating its applications beyond simple cell counting. We'll cover various scenarios, from exact and partial matches to han
