

how to make a table in excel

How to Make a Table in Excel
Creating a table in Excel is a straightforward process that can help you organize and analyze your data more effectively. Here are the steps to create a basic table:
- Open Excel: Start by opening Microsoft Excel on your computer.
- Enter Data: Input your data into the worksheet. Ensure that your data is organized in rows and columns, with headers at the top of each column.
- Select Data: Click and drag to select the range of cells that you want to convert into a table. Make sure to include the headers.
-
Insert Table: Go to the "Insert" tab on the ribbon, and click on the "Table" button. Alternatively, you can use the shortcut
Ctrl T. - Confirm Table Range: A dialog box will appear, asking you to confirm the range of cells you've selected. Ensure the "My table has headers" checkbox is ticked if your data includes headers, then click "OK."
- Table Creation: Excel will automatically format your selected data into a table, with filter arrows in the header row for easy data sorting and filtering.
What are the Steps to Format a Table in Excel?
Formatting a table in Excel helps improve readability and can make your data more visually appealing. Here are the steps to format a table:
- Select the Table: Click anywhere inside the table you want to format.
- Access Table Tools: Once the table is selected, the "Table Design" tab will appear on the ribbon. Click on it to access various formatting options.
- Choose a Table Style: Under the "Table Styles" section, you'll see various pre-designed table styles. Click on one to apply it to your table. You can hover over the styles to see a live preview before making a selection.
- Customize Table Style: If you want more control over the formatting, click on the "More" button (it looks like a small arrow) in the "Table Styles" section to expand the gallery. You can also use the "New Table Style" option to create a custom style.
- Adjust Table Elements: Use the options in the "Table Style Options" group to toggle features like header row, total row, banded rows, and banded columns on or off.
- Resize the Table: If you need to adjust the size of your table, you can drag the resize handle in the bottom-right corner of the table, or use the "Resize Table" option found under the "Table Design" tab.
- Format Cells: To further customize individual cells, rows, or columns, you can use the standard Excel formatting tools found in the "Home" tab, such as font size, cell color, and borders.
How Can I Customize the Style of a Table in Excel?
Customizing the style of a table in Excel allows you to tailor its appearance to suit your preferences or to meet specific requirements. Here's how you can do it:
- Select the Table: Click inside the table to select it.
- Open Table Design: Go to the "Table Design" tab on the ribbon.
- Select a Predefined Style: Browse through the "Table Styles" gallery and select a style that suits your needs. Hover over the styles to see a live preview.
- Create a Custom Style: If none of the predefined styles meet your requirements, click on "New Table Style" in the "Table Styles" gallery. This opens a dialog box where you can define every aspect of the table's appearance, including font, colors, and border styles.
- Modify Table Elements: Use the "Table Style Options" to toggle on or off elements such as header row, total row, first column, last column, banded rows, and banded columns.
- Adjust Cell Formatting: Use the formatting tools in the "Home" tab to change the font, size, color, and alignment of cells within the table. You can also apply conditional formatting to highlight specific data based on certain criteria.
- Save Custom Style: If you've created a custom style that you want to use in the future, click "New Table Style," name your style, and click "OK." Your custom style will then be available in the "Table Styles" gallery.
What Functions Can I Use to Analyze Data Within an Excel Table?
Excel offers a variety of functions and tools that can be used to analyze data within a table. Here are some useful functions and their applications:
-
SUM: This function calculates the total of selected numerical values. For example,
=SUM(Table1[Column1])will sum all values in Column1 of Table1. -
AVERAGE: This function calculates the average of selected numerical values. For instance,
=AVERAGE(Table1[Column1])will find the average of all values in Column1 of Table1. -
MIN and MAX: These functions find the minimum and maximum values in a range. For example,
=MIN(Table1[Column1])and=MAX(Table1[Column1])will return the lowest and highest values in Column1, respectively. -
COUNT and COUNTA: These functions count the number of cells that contain numbers or any type of data, respectively. For instance,
=COUNT(Table1[Column1])will count the number of cells with numerical values in Column1, while=COUNTA(Table1[Column1])will count all non-empty cells. -
VLOOKUP and HLOOKUP: These functions allow you to search for a value in a table and return a corresponding value from another column or row. For example,
=VLOOKUP(value, Table1, column_index, FALSE)will look up a value in Table1 and return data from the specified column. -
INDEX and MATCH: These functions can be used together to perform more flexible lookups than VLOOKUP or HLOOKUP.
=INDEX(Table1[Column1], MATCH(value, Table1[Column2], 0))will find a value in Column2 and return the corresponding value from Column1. -
SUBTOTAL: This function calculates a subtotal in a list or database, ignoring rows hidden by filters. For instance,
=SUBTOTAL(9, Table1[Column1])will sum all visible values in Column1. - PivotTable: While not a function, PivotTables are powerful tools for summarizing, analyzing, exploring, and presenting data. You can create a PivotTable from your Excel table by selecting the table, going to the "Insert" tab, and clicking on "PivotTable."
Using these functions and tools, you can perform comprehensive data analysis within an Excel table, helping you to make more informed decisions based on your data.
The above is the detailed content of how to make a table in excel. For more information, please follow other related articles on the PHP Chinese website!

Hot AI Tools

Undresser.AI Undress
AI-powered app for creating realistic nude photos

AI Clothes Remover
Online AI tool for removing clothes from photos.

Undress AI Tool
Undress images for free

Clothoff.io
AI clothes remover

Video Face Swap
Swap faces in any video effortlessly with our completely free AI face swap tool!

Hot Article
Hot Tools

Notepad++7.3.1
Easy-to-use and free code editor

SublimeText3 Chinese version
Chinese version, very easy to use

Zend Studio 13.0.1
Powerful PHP integrated development environment

Dreamweaver CS6
Visual web development tools

SublimeText3 Mac version
God-level code editing software (SublimeText3)
Hot Topics
 1655
1655
 14
1413
52
1306
25
1252
29
1226
24
14
1413
52
1306
25
1252
29
1226
24

 How to use Flash Fill in Excel with examples
Apr 05, 2025 am 09:15 AM
How to use Flash Fill in Excel with examples
Apr 05, 2025 am 09:15 AM
This tutorial provides a comprehensive guide to Excel's Flash Fill feature, a powerful tool for automating data entry tasks. It covers various aspects, from its definition and location to advanced usage and troubleshooting. Understanding Excel's Fla
 MEDIAN formula in Excel - practical examples
Apr 11, 2025 pm 12:08 PM
MEDIAN formula in Excel - practical examples
Apr 11, 2025 pm 12:08 PM
This tutorial explains how to calculate the median of numerical data in Excel using the MEDIAN function. The median, a key measure of central tendency, identifies the middle value in a dataset, offering a more robust representation of central tenden
 Excel shared workbook: How to share Excel file for multiple users
Apr 11, 2025 am 11:58 AM
Excel shared workbook: How to share Excel file for multiple users
Apr 11, 2025 am 11:58 AM
This tutorial provides a comprehensive guide to sharing Excel workbooks, covering various methods, access control, and conflict resolution. Modern Excel versions (2010, 2013, 2016, and later) simplify collaborative editing, eliminating the need to m
 How to spell check in Excel
Apr 06, 2025 am 09:10 AM
How to spell check in Excel
Apr 06, 2025 am 09:10 AM
This tutorial demonstrates various methods for spell-checking in Excel: manual checks, VBA macros, and using a specialized tool. Learn to check spelling in cells, ranges, worksheets, and entire workbooks. While Excel isn't a word processor, its spel
 Excel: Group rows automatically or manually, collapse and expand rows
Apr 08, 2025 am 11:17 AM
Excel: Group rows automatically or manually, collapse and expand rows
Apr 08, 2025 am 11:17 AM
This tutorial demonstrates how to streamline complex Excel spreadsheets by grouping rows, making data easier to analyze. Learn to quickly hide or show row groups and collapse the entire outline to a specific level. Large, detailed spreadsheets can be
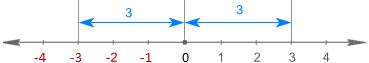 Absolute value in Excel: ABS function with formula examples
Apr 06, 2025 am 09:12 AM
Absolute value in Excel: ABS function with formula examples
Apr 06, 2025 am 09:12 AM
This tutorial explains the concept of absolute value and demonstrates practical Excel applications of the ABS function for calculating absolute values within datasets. Numbers can be positive or negative, but sometimes only positive values are neede
 Google Spreadsheet COUNTIF function with formula examples
Apr 11, 2025 pm 12:03 PM
Google Spreadsheet COUNTIF function with formula examples
Apr 11, 2025 pm 12:03 PM
Master Google Sheets COUNTIF: A Comprehensive Guide This guide explores the versatile COUNTIF function in Google Sheets, demonstrating its applications beyond simple cell counting. We'll cover various scenarios, from exact and partial matches to han
 How to convert Excel to JPG - save .xls or .xlsx as image file
Apr 11, 2025 am 11:31 AM
How to convert Excel to JPG - save .xls or .xlsx as image file
Apr 11, 2025 am 11:31 AM
This tutorial explores various methods for converting .xls files to .jpg images, encompassing both built-in Windows tools and free online converters. Need to create a presentation, share spreadsheet data securely, or design a document? Converting yo
