

Can excel recognize outliers

Can Excel Identify Outliers?
Yes, Excel can identify outliers, although it doesn't have a single built-in function specifically labeled "outlier detection." Instead, outlier identification in Excel relies on a combination of techniques leveraging its statistical functions and visual tools. The process involves understanding your data, choosing an appropriate method for detecting outliers based on your data's distribution and characteristics, and then using Excel's features to implement that method. Outliers are typically defined as data points that significantly deviate from the rest of the data set, often indicating errors, anomalies, or genuinely unusual observations. The challenge lies in objectively determining what constitutes a "significant deviation."
How Can I Identify Outliers in My Excel Data?
Several methods can be used to identify outliers in your Excel data. The best approach depends on your data's distribution and the context of your analysis. Here are some common techniques:
1. Visual Inspection (Box Plots and Scatter Plots): This is a quick and intuitive first step. Create a box plot for your data using the "Insert" tab and selecting "Box and Whisker". Outliers are often visually represented as points outside the "whiskers" of the box plot. Similarly, scatter plots can help reveal outliers when plotting one variable against another. Looking for points significantly distanced from the main cluster of data points can highlight potential outliers.
2. Z-Score Method: This method standardizes your data, calculating how many standard deviations each data point is from the mean. A commonly used threshold is ±3. Data points with a Z-score greater than 3 or less than -3 are often considered outliers. You can calculate the Z-score in Excel using the STANDARDIZE function: =STANDARDIZE(value, mean, standard_deviation). You'll need to calculate the mean and standard deviation separately using AVERAGE and STDEV functions, respectively.
3. Interquartile Range (IQR) Method: This method is less sensitive to extreme values than the Z-score method. It focuses on the spread of the middle 50% of your data. Outliers are defined as data points below Q1 - 1.5IQR or above Q3 1.5IQR, where Q1 and Q3 are the first and third quartiles, and IQR = Q3 - Q1. Excel functions QUARTILE.EXC (or QUARTILE in older versions) can be used to find the quartiles.
4. Data Cleaning and Contextual Analysis: Before applying any statistical method, visually inspect your data for obvious errors (e.g., typos, incorrect units). Consider the context of your data. A seemingly outlying value might be valid given the circumstances.
What Are the Best Methods for Detecting Anomalies in Excel Spreadsheets?
The "best" method for detecting anomalies (outliers) in Excel depends on the specific characteristics of your data and the goals of your analysis. There's no universally superior approach. However, a combination of methods often provides the most robust results.
- For normally distributed data: The Z-score method is often suitable.
- For data with skewed distributions or potential for extreme values: The IQR method is more robust.
- For exploratory analysis or quick identification: Visual inspection using box plots and scatter plots is invaluable.
It's crucial to remember that outlier detection isn't just about identifying extreme values; it's also about understanding why those values are extreme. Further investigation is often necessary to determine if an outlier represents an error, a genuinely unusual observation, or a significant finding that warrants further attention.
Are There Any Built-in Excel Functions or Add-ins to Help with Outlier Detection?
Excel doesn't offer a single, dedicated function for outlier detection. However, several built-in functions facilitate the methods described above:
-
AVERAGEandSTDEV: Used to calculate the mean and standard deviation for the Z-score method. -
QUARTILE.EXC(orQUARTILE): Used to calculate quartiles for the IQR method. -
STANDARDIZE: Calculates the Z-score for each data point. -
COUNTIFandCOUNTIFS: Can help count outliers based on the thresholds you've defined using the Z-score or IQR methods.
While there aren't specific outlier detection add-ins directly integrated into Excel, you might find third-party add-ins or VBA macros that offer more sophisticated outlier detection capabilities, particularly for larger datasets or more complex scenarios. However, the built-in functions provide a solid foundation for most outlier detection tasks. Remember that interpreting the results always requires careful consideration of the context of your data.
The above is the detailed content of Can excel recognize outliers. For more information, please follow other related articles on the PHP Chinese website!

Hot AI Tools

Undresser.AI Undress
AI-powered app for creating realistic nude photos

AI Clothes Remover
Online AI tool for removing clothes from photos.

Undress AI Tool
Undress images for free

Clothoff.io
AI clothes remover

Video Face Swap
Swap faces in any video effortlessly with our completely free AI face swap tool!

Hot Article
Hot Tools

Notepad++7.3.1
Easy-to-use and free code editor

SublimeText3 Chinese version
Chinese version, very easy to use

Zend Studio 13.0.1
Powerful PHP integrated development environment

Dreamweaver CS6
Visual web development tools

SublimeText3 Mac version
God-level code editing software (SublimeText3)
Hot Topics


 Excel formula to find top 3, 5, 10 values in column or row
Apr 01, 2025 am 05:09 AM
Excel formula to find top 3, 5, 10 values in column or row
Apr 01, 2025 am 05:09 AM
This tutorial demonstrates how to efficiently locate the top N values within a dataset and retrieve associated data using Excel formulas. Whether you need the highest, lowest, or those meeting specific criteria, this guide provides solutions. Findi
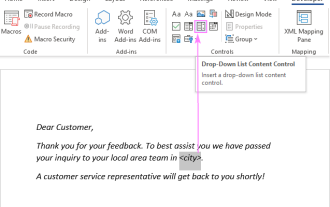 Add a dropdown list to Outlook email template
Apr 01, 2025 am 05:13 AM
Add a dropdown list to Outlook email template
Apr 01, 2025 am 05:13 AM
This tutorial shows you how to add dropdown lists to your Outlook email templates, including multiple selections and database population. While Outlook doesn't directly support dropdowns, this guide provides creative workarounds. Email templates sav
 How to add calendar to Outlook: shared, Internet calendar, iCal file
Apr 03, 2025 am 09:06 AM
How to add calendar to Outlook: shared, Internet calendar, iCal file
Apr 03, 2025 am 09:06 AM
This article explains how to access and utilize shared calendars within the Outlook desktop application, including importing iCalendar files. Previously, we covered sharing your Outlook calendar. Now, let's explore how to view calendars shared with
 How to use Flash Fill in Excel with examples
Apr 05, 2025 am 09:15 AM
How to use Flash Fill in Excel with examples
Apr 05, 2025 am 09:15 AM
This tutorial provides a comprehensive guide to Excel's Flash Fill feature, a powerful tool for automating data entry tasks. It covers various aspects, from its definition and location to advanced usage and troubleshooting. Understanding Excel's Fla
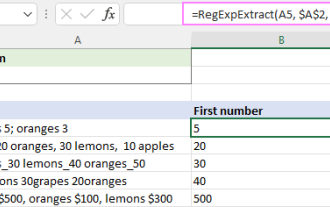 Regex to extract strings in Excel (one or all matches)
Mar 28, 2025 pm 12:19 PM
Regex to extract strings in Excel (one or all matches)
Mar 28, 2025 pm 12:19 PM
In this tutorial, you'll learn how to use regular expressions in Excel to find and extract substrings matching a given pattern. Microsoft Excel provides a number of functions to extract text from cells. Those functions can cope with most
 MEDIAN formula in Excel - practical examples
Apr 11, 2025 pm 12:08 PM
MEDIAN formula in Excel - practical examples
Apr 11, 2025 pm 12:08 PM
This tutorial explains how to calculate the median of numerical data in Excel using the MEDIAN function. The median, a key measure of central tendency, identifies the middle value in a dataset, offering a more robust representation of central tenden
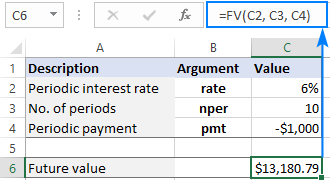 FV function in Excel to calculate future value
Apr 01, 2025 am 04:57 AM
FV function in Excel to calculate future value
Apr 01, 2025 am 04:57 AM
This tutorial explains how to use Excel's FV function to determine the future value of investments, encompassing both regular payments and lump-sum deposits. Effective financial planning hinges on understanding investment growth, and this guide prov
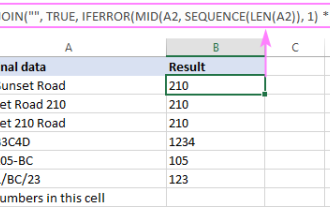 How to remove / split text and numbers in Excel cell
Apr 01, 2025 am 05:07 AM
How to remove / split text and numbers in Excel cell
Apr 01, 2025 am 05:07 AM
This tutorial demonstrates several methods for separating text and numbers within Excel cells, utilizing both built-in functions and custom VBA functions. You'll learn how to extract numbers while removing text, isolate text while discarding numbers
