

can excel find outliers

Can Excel Find Outliers by Analyzing Data?
Yes, Excel has built-in functions and features to identify outliers within a dataset. By analyzing the distribution of data points and comparing them to the overall trend, Excel can detect values that deviate significantly from the norm.
How Does Excel Identify Outliers Within a Dataset?
Excel uses statistical measures such as the mean, median, and standard deviation to assess the data distribution. Outliers are typically identified as data points that fall outside a predefined range based on these measures.
What Methods Does Excel Use to Detect Outliers Effectively?
Excel employs various methods to effectively detect outliers:
1. Interquartile Range:
- Calculates the difference between the 75th and 25th percentile (IQR).
- Values more than 1.5 * IQR above the 75th percentile or below the 25th percentile are considered outliers.
2. Standard Deviation:
- Measures the dispersion of data around the mean.
- Values more than 3 standard deviations above or below the mean are considered outliers.
3. Z-Score:
- Standard deviation value representing the distance of a data point from the mean in standard deviation units.
- Absolute Z-scores greater than 3 are often considered outliers.
The above is the detailed content of can excel find outliers. For more information, please follow other related articles on the PHP Chinese website!

Hot AI Tools

Undresser.AI Undress
AI-powered app for creating realistic nude photos

AI Clothes Remover
Online AI tool for removing clothes from photos.

Undress AI Tool
Undress images for free

Clothoff.io
AI clothes remover

Video Face Swap
Swap faces in any video effortlessly with our completely free AI face swap tool!

Hot Article
Hot Tools

Notepad++7.3.1
Easy-to-use and free code editor

SublimeText3 Chinese version
Chinese version, very easy to use

Zend Studio 13.0.1
Powerful PHP integrated development environment

Dreamweaver CS6
Visual web development tools

SublimeText3 Mac version
God-level code editing software (SublimeText3)
Hot Topics
 1657
1657
 14
1415
52
1309
25
1257
29
1231
24
14
1415
52
1309
25
1257
29
1231
24

 MEDIAN formula in Excel - practical examples
Apr 11, 2025 pm 12:08 PM
MEDIAN formula in Excel - practical examples
Apr 11, 2025 pm 12:08 PM
This tutorial explains how to calculate the median of numerical data in Excel using the MEDIAN function. The median, a key measure of central tendency, identifies the middle value in a dataset, offering a more robust representation of central tenden
 How to spell check in Excel
Apr 06, 2025 am 09:10 AM
How to spell check in Excel
Apr 06, 2025 am 09:10 AM
This tutorial demonstrates various methods for spell-checking in Excel: manual checks, VBA macros, and using a specialized tool. Learn to check spelling in cells, ranges, worksheets, and entire workbooks. While Excel isn't a word processor, its spel
 Excel shared workbook: How to share Excel file for multiple users
Apr 11, 2025 am 11:58 AM
Excel shared workbook: How to share Excel file for multiple users
Apr 11, 2025 am 11:58 AM
This tutorial provides a comprehensive guide to sharing Excel workbooks, covering various methods, access control, and conflict resolution. Modern Excel versions (2010, 2013, 2016, and later) simplify collaborative editing, eliminating the need to m
 Google Spreadsheet COUNTIF function with formula examples
Apr 11, 2025 pm 12:03 PM
Google Spreadsheet COUNTIF function with formula examples
Apr 11, 2025 pm 12:03 PM
Master Google Sheets COUNTIF: A Comprehensive Guide This guide explores the versatile COUNTIF function in Google Sheets, demonstrating its applications beyond simple cell counting. We'll cover various scenarios, from exact and partial matches to han
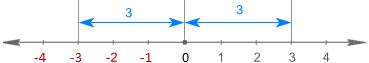 Absolute value in Excel: ABS function with formula examples
Apr 06, 2025 am 09:12 AM
Absolute value in Excel: ABS function with formula examples
Apr 06, 2025 am 09:12 AM
This tutorial explains the concept of absolute value and demonstrates practical Excel applications of the ABS function for calculating absolute values within datasets. Numbers can be positive or negative, but sometimes only positive values are neede
 Excel: Group rows automatically or manually, collapse and expand rows
Apr 08, 2025 am 11:17 AM
Excel: Group rows automatically or manually, collapse and expand rows
Apr 08, 2025 am 11:17 AM
This tutorial demonstrates how to streamline complex Excel spreadsheets by grouping rows, making data easier to analyze. Learn to quickly hide or show row groups and collapse the entire outline to a specific level. Large, detailed spreadsheets can be
 How to convert Excel to JPG - save .xls or .xlsx as image file
Apr 11, 2025 am 11:31 AM
How to convert Excel to JPG - save .xls or .xlsx as image file
Apr 11, 2025 am 11:31 AM
This tutorial explores various methods for converting .xls files to .jpg images, encompassing both built-in Windows tools and free online converters. Need to create a presentation, share spreadsheet data securely, or design a document? Converting yo
 Google sheets chart tutorial: how to create charts in google sheets
Apr 11, 2025 am 09:06 AM
Google sheets chart tutorial: how to create charts in google sheets
Apr 11, 2025 am 09:06 AM
This tutorial shows you how to create various charts in Google Sheets, choosing the right chart type for different data scenarios. You'll also learn how to create 3D and Gantt charts, and how to edit, copy, and delete charts. Visualizing data is cru
