
 Backend Development
Python Tutorial
From Data to Strategies: How Statistics Can Drive Trustworthy Marketing Decisions
Backend Development
Python Tutorial
From Data to Strategies: How Statistics Can Drive Trustworthy Marketing Decisions
From Data to Strategies: How Statistics Can Drive Trustworthy Marketing Decisions

statistics is a powerful tool that allows us to address complex problems and answer questions that arise when observing data or patterns for the first time. An example of this could be analyzing the personality of customers in a supermarket. Questions like Is this group really different from the other? To what extent? Should I focus more on this group to improve their experience and my sales? They are key to making good decisions.
While visualizations can help us understand data quickly, they are not always 100% reliable. We could observe clear differences between groups, but those differences may not be statistically significant.
This is where statistics comes into play: not only does it help us analyze the data more deeply, but it gives us the confidence to validate our assumptions. As data scientists or decision-making professionals, we must be aware that incorrect analysis can lead to wrong decisions, resulting in loss of time and money. Therefore, it is crucial that our conclusions are well-founded, supported by statistical evidence.

True satisfaction comes when we see the results of our analysis reflected in effective changes within the company, improvements in the customer experience, and, ultimately, a positive impact on sales and operations. It's an incredible feeling to have been part of that process!
To help you develop this skill we will develop in this article in Personality Analysis of supermarket customers, we will use the Kaggle Dataset Customer Personality Analysis: https://www.kaggle.com/datasets /imakash3011/customer-personality-analysis
In this analysis, we will explore the behavior of a supermarket's customers with the aim of extracting valuable information from the data. We will seek to answer the following questions:
- Is there any significant difference in total spending by Education?
- Is there a significant difference in total spending by Number of children?
- Is there any significant difference in total spending by Marital Status?
Although this analysis could be extended much further, we will focus on answering these three questions, as they offer great explanatory power. Throughout the article, we will show you how we can address these questions and how, through the same approach, we could answer many more questions.
In this article we will explore statistical analyzes such as the Kolmogorov-Smirnov test, the Levene test, and how to know when to apply ANOVA or Kruskal -Wallis. These names may sound unfamiliar to you, but don't worry, I will explain them in a simple way so that you understand them without complications.
Next, I will show you the Python code and the steps to follow to perform these statistical analyzes effectively.
1. Getting started
We import the necessary Python libraries.
import pandas as pd
import matplotlib.pyplot as plt
import seaborn as sns
import numpy as np
import os
Now we can choose two ways to upload the .csv file, we directly get the file or we can get the kaggle link, right on the download button.
#pip install kagglehub
import kagglehub
# Download latest version
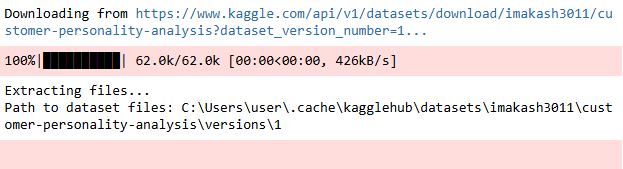
path = kagglehub.dataset_download("imakash3011/customer-personality-analysis")
print("Path to dataset files:", path)
import pandas as pd
import matplotlib.pyplot as plt
import seaborn as sns
import numpy as np
import os
#pip install kagglehub
import kagglehub

# Download latest version
path = kagglehub.dataset_download("imakash3011/customer-personality-analysis")

print("Path to dataset files:", path)
#Obtenemos el nombre del archivo
nombre_archivo = os.listdir(path)[0]
nombre_archivo
| ID | Year_Birth | Education | Marital_Status | Income | Kidhome | Teenhome | Dt_Customer | Recency | MntWines | MntFruits | MntMeatProducts | MntFishProducts | MntSweetProducts | MntGoldProds | NumDealsPurchases | NumWebPurchases | NumCatalogPurchases | NumStorePurchases | NumWebVisitsMonth | AcceptedCmp3 | AcceptedCmp4 | AcceptedCmp5 | AcceptedCmp1 | AcceptedCmp2 | Complain | Z_CostContact | Z_Revenue | Response | |
|---|---|---|---|---|---|---|---|---|---|---|---|---|---|---|---|---|---|---|---|---|---|---|---|---|---|---|---|---|---|
| 0 | 5524 | 1957 | Graduation | Single | 58138.0 | 0 | 0 | 04-09-2012 | 58 | 635 | 88 | 546 | 172 | 88 | 88 | 3 | 8 | 10 | 4 | 7 | 0 | 0 | 0 | 0 | 0 | 0 | 3 | 11 | 1 |
| 1 | 2174 | 1954 | Graduation | Single | 46344.0 | 1 | 1 | 08-03-2014 | 38 | 11 | 1 | 6 | 2 | 1 | 6 | 2 | 1 | 1 | 2 | 5 | 0 | 0 | 0 | 0 | 0 | 0 | 3 | 11 | 0 |
| 2 | 4141 | 1965 | Graduation | Together | 71613.0 | 0 | 0 | 21-08-2013 | 26 | 426 | 49 | 127 | 111 | 21 | 42 | 1 | 8 | 2 | 10 | 4 | 0 | 0 | 0 | 0 | 0 | 0 | 3 | 11 | 0 |
To have a better idea of the data set that we will analyze, I will indicate the meaning of each column.
Columns:
-
People:
- ID: unique identifier of the client
- Year_Birth: year of birth of the client.
- Education: level of education of the client.
- Marital_Status: client's marital status
- Income: annual income of the client's household
- Kidhome: Number of children in the client's home
- Teenhome: Number of teenagers in the client's home
- Dt_Customer: Customer registration date in the company
- Recency: number of days since the customer's last purchase.
- Complain: 1 if the customer complained in the last 2 years, 0 otherwise
-
Products:
- MntWines: Amount spent on wine in the last 2 years.
- MntFruits: Amount spent on fruits in the last 2 years.
- MntMeatProducts: Amount spent on meat in the last 2 years.
- MntFishProducts: amount spent on fish in the last 2 years.
- MntSweetProducts: amount spent on sweets in the last 2 years.
- MntGoldProds: amount spent on gold in the last 2 years.
-
Promotion:
- NumDealsPurchases: Number of purchases made with a discount.
- AcceptedCmp1: 1 if the customer accepted the offer in the first campaign, 0 otherwise.
- AcceptedCmp2: 1 if the customer accepted the offer in the second campaign, 0 otherwise.
- AcceptedCmp3: 1 if the customer accepted the offer in the third campaign, 0 otherwise.
- AcceptedCmp4: 1 if the customer accepted the offer in the fourth campaign, 0 otherwise.
- AcceptedCmp5: 1 if the customer accepted the offer in the fifth campaign, 0 otherwise.
- Response: 1 if the customer accepted the offer in the last campaign, 0 otherwise
-
Place:
- NumWebPurchases: Number of purchases made through the company website.
- NumCatalogPurchases: Number of purchases made through a catalog.
- NumStorePurchases: Number of purchases made directly in stores.
- NumWebVisitsMonth: Number of visits to the company's website in the last month.
Yes, there are many columns, however here we will only use a few, so as not to extend too much, in any case you can apply the same steps for the other columns.
Now, we will verify that we do not have null data
import pandas as pd
import matplotlib.pyplot as plt
import seaborn as sns
import numpy as np
import os
#pip install kagglehub
import kagglehub

# Download latest version
path = kagglehub.dataset_download("imakash3011/customer-personality-analysis")

print("Path to dataset files:", path)
We can notice that we have 24 null data in the Income column, however this column will not be used in this analysis therefore we will not do anything with it, in case you want to use it, you must verify perform one of these two options:
- Impute the missing data if it does not represent more than 5% of the total data (recommendation).
- Delete null data.
2. Configure the Dataset for analysis
We will keep the columns that are of interest to us, such as education, children, marital status, amount of spending per product category, among others.
#Obtenemos el nombre del archivo
nombre_archivo = os.listdir(path)[0]
nombre_archivo
We calculate the total expense by adding the expenses of all product categories.
'marketing_campaign.csv'
The above is the detailed content of From Data to Strategies: How Statistics Can Drive Trustworthy Marketing Decisions. For more information, please follow other related articles on the PHP Chinese website!

Hot AI Tools

Undresser.AI Undress
AI-powered app for creating realistic nude photos

AI Clothes Remover
Online AI tool for removing clothes from photos.

Undress AI Tool
Undress images for free

Clothoff.io
AI clothes remover

Video Face Swap
Swap faces in any video effortlessly with our completely free AI face swap tool!

Hot Article
Hot Tools

Notepad++7.3.1
Easy-to-use and free code editor

SublimeText3 Chinese version
Chinese version, very easy to use

Zend Studio 13.0.1
Powerful PHP integrated development environment

Dreamweaver CS6
Visual web development tools

SublimeText3 Mac version
God-level code editing software (SublimeText3)
Hot Topics
 1668
1668
 14
1427
52
1329
25
1273
29
1256
24
14
1427
52
1329
25
1273
29
1256
24

 Python: Games, GUIs, and More
Apr 13, 2025 am 12:14 AM
Python: Games, GUIs, and More
Apr 13, 2025 am 12:14 AM
Python excels in gaming and GUI development. 1) Game development uses Pygame, providing drawing, audio and other functions, which are suitable for creating 2D games. 2) GUI development can choose Tkinter or PyQt. Tkinter is simple and easy to use, PyQt has rich functions and is suitable for professional development.
 Python vs. C : Learning Curves and Ease of Use
Apr 19, 2025 am 12:20 AM
Python vs. C : Learning Curves and Ease of Use
Apr 19, 2025 am 12:20 AM
Python is easier to learn and use, while C is more powerful but complex. 1. Python syntax is concise and suitable for beginners. Dynamic typing and automatic memory management make it easy to use, but may cause runtime errors. 2.C provides low-level control and advanced features, suitable for high-performance applications, but has a high learning threshold and requires manual memory and type safety management.
 Python and Time: Making the Most of Your Study Time
Apr 14, 2025 am 12:02 AM
Python and Time: Making the Most of Your Study Time
Apr 14, 2025 am 12:02 AM
To maximize the efficiency of learning Python in a limited time, you can use Python's datetime, time, and schedule modules. 1. The datetime module is used to record and plan learning time. 2. The time module helps to set study and rest time. 3. The schedule module automatically arranges weekly learning tasks.
 Python vs. C : Exploring Performance and Efficiency
Apr 18, 2025 am 12:20 AM
Python vs. C : Exploring Performance and Efficiency
Apr 18, 2025 am 12:20 AM
Python is better than C in development efficiency, but C is higher in execution performance. 1. Python's concise syntax and rich libraries improve development efficiency. 2.C's compilation-type characteristics and hardware control improve execution performance. When making a choice, you need to weigh the development speed and execution efficiency based on project needs.
 Which is part of the Python standard library: lists or arrays?
Apr 27, 2025 am 12:03 AM
Which is part of the Python standard library: lists or arrays?
Apr 27, 2025 am 12:03 AM
Pythonlistsarepartofthestandardlibrary,whilearraysarenot.Listsarebuilt-in,versatile,andusedforstoringcollections,whereasarraysareprovidedbythearraymoduleandlesscommonlyusedduetolimitedfunctionality.
 Python: Automation, Scripting, and Task Management
Apr 16, 2025 am 12:14 AM
Python: Automation, Scripting, and Task Management
Apr 16, 2025 am 12:14 AM
Python excels in automation, scripting, and task management. 1) Automation: File backup is realized through standard libraries such as os and shutil. 2) Script writing: Use the psutil library to monitor system resources. 3) Task management: Use the schedule library to schedule tasks. Python's ease of use and rich library support makes it the preferred tool in these areas.
 Learning Python: Is 2 Hours of Daily Study Sufficient?
Apr 18, 2025 am 12:22 AM
Learning Python: Is 2 Hours of Daily Study Sufficient?
Apr 18, 2025 am 12:22 AM
Is it enough to learn Python for two hours a day? It depends on your goals and learning methods. 1) Develop a clear learning plan, 2) Select appropriate learning resources and methods, 3) Practice and review and consolidate hands-on practice and review and consolidate, and you can gradually master the basic knowledge and advanced functions of Python during this period.
 Python vs. C : Understanding the Key Differences
Apr 21, 2025 am 12:18 AM
Python vs. C : Understanding the Key Differences
Apr 21, 2025 am 12:18 AM
Python and C each have their own advantages, and the choice should be based on project requirements. 1) Python is suitable for rapid development and data processing due to its concise syntax and dynamic typing. 2)C is suitable for high performance and system programming due to its static typing and manual memory management.
