

Metrics for regression algorithms

Error Metrics for Regression Algorithms
When we create a regression algorithm and want to know how efficient this model was, we use error metrics to obtain values that represent the error of our machine learning model. The metrics in this article are important when we want to measure the error of prediction models for numerical values (real, integers).
In this article we will cover the main error metrics for regression algorithms, performing the calculations manually in Python and measuring the error of the machine learning model on a dollar quote dataset.
Metrics Addressed
- SE — Sum of error
- ME — Mean error
- MAE — Mean Absolute error
- MPE — Mean Percentage error
- MAPAE — Mean Absolute Percentage error
Both metrics are a little similar, where we have metrics for average and percentage of error and metrics for average and absolute percentage of error, differentiated so only that one group obtains the real value of the difference and the other obtains the absolute value of the difference. difference. It is important to remember that in both metrics, the lower the value, the better our forecast.
SE — Sum of error
The SE metric is the simplest among all in this article, where its formula is:
SE = εR — P
Therefore, it is the sum of the difference between the real value (target variable of the model) and the predicted value. This metric has some negative points, such as not treating values as absolute, which will consequently result in a false value.
ME — Mean of error
The ME metric is a "complement" of the SE, where we basically have the difference that we will obtain an average of the SE given the number of elements:
ME = ε(R-P)/N
Unlike SE, we just divide the SE result by the number of elements. This metric, like SE, depends on scale, that is, we must use the same set of data and can compare with different forecasting models.
MAE — Mean absolute error

The MAE metric is the ME but considering only absolute (non-negative) values. When we are calculating the difference between actual and predicted, we may have negative results and this negative difference is applied to previous metrics. In this metric, we have to transform the difference into positive values and then take the average based on the number of elements.
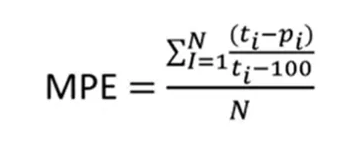
MPE — Mean Percentage error
The MPE metric is the average error as a percentage of the sum of each difference. Here we have to take the percentage of the difference, add it and then divide it by the number of elements to obtain the average. Therefore, the difference between the actual value and the predicted value is made, divided by the actual value, multiplied by 100, we add up all this percentage and divide by the number of elements. This metric is independent of scale (%).
MAPAE — Mean Absolute Percentage error
The MAPAE metric is very similar to the previous metric, but the difference between the predicted x actual is made absolutely, that is, you calculate it with positive values. Therefore, this metric is the absolute difference in the percentage of error. This metric is also scale independent.

Using metrics in practice
Given an explanation of each metric, we will calculate both manually in Python based on a prediction from a dollar exchange rate machine learning model. Currently, most of the regression metrics exist in ready-made functions in the Sklearn package, however here we will calculate them manually for teaching purposes only.
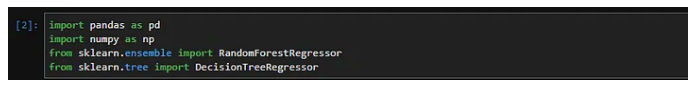
We will use the RandomForest and Decision Tree algorithms only to compare results between the two models.
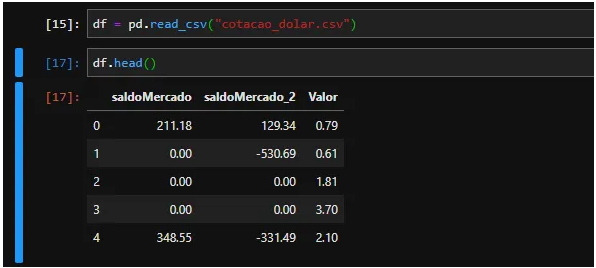
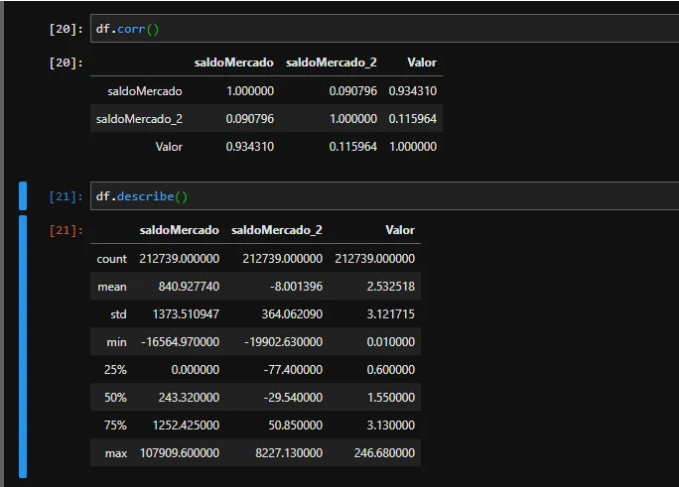
Data Analysis
In our dataset, we have a column of SaldoMercado and saldoMercado_2 which are information that influence the Value column (our dollar quote). As we can see, the MercadoMercado balance has a closer relationship to the quote than theMerado_2 balance. It is also possible to observe that we do not have missing values (infinite or Nan values) and that the balanceMercado_2 column has many non-absolute values.

Model Preparation
We prepare our values for the machine learning model by defining the predictor variables and the variable we want to predict. We use train_test_split to randomly divide the data into 30% for testing and 70% for training.

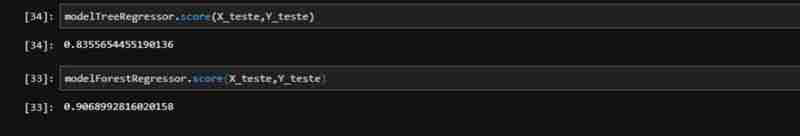
Finally, we initialize both algorithms (RandomForest and DecisionTree), fit the data and measure the score of both with the test data. We obtained a score of 83% for TreeRegressor and 90% for ForestRegressor, which in theory indicates that ForestRegressor performed better.
Results and Analysis
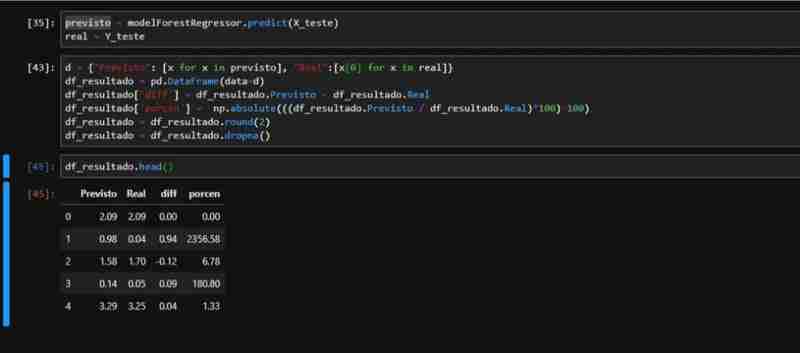
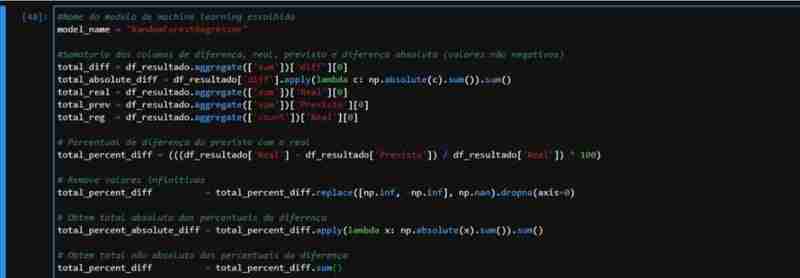
Given the partially observed performance of ForestRegressor, we created a dataset with the necessary data to apply the metrics. We perform the prediction on the test data and create a DataFrame with the actual and predicted values, including columns for difference and percentage.

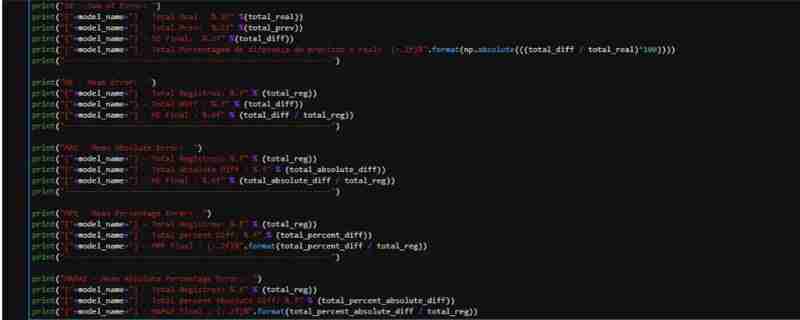
We can observe that in relation to the real total of the dollar rate vs the rate that our model predicted:
- We had a total difference of R$578.00
- This represents 0.36% difference between predicted x Actual (not considered absolute values)
- In terms of the average error (ME) we had a low value, an average of R$0.009058
- For absolute average, this value increases a little, since we have negative values in our dataset
I reinforce that here we perform the calculation manually for teaching purposes. However, it is recommended to use the metrics functions from the Sklearn package due to better performance and low chance of error in the calculation.
The complete code is available on my GitHub: github.com/AirtonLira/artigo_metricasregressao
Author: Airton Lira Junior
LinkedIn: linkedin.com/in/airton-lira-junior-6b81a661/
The above is the detailed content of Metrics for regression algorithms. For more information, please follow other related articles on the PHP Chinese website!

Hot AI Tools

Undresser.AI Undress
AI-powered app for creating realistic nude photos

AI Clothes Remover
Online AI tool for removing clothes from photos.

Undress AI Tool
Undress images for free

Clothoff.io
AI clothes remover

Video Face Swap
Swap faces in any video effortlessly with our completely free AI face swap tool!

Hot Article
Hot Tools

Notepad++7.3.1
Easy-to-use and free code editor

SublimeText3 Chinese version
Chinese version, very easy to use

Zend Studio 13.0.1
Powerful PHP integrated development environment

Dreamweaver CS6
Visual web development tools

SublimeText3 Mac version
God-level code editing software (SublimeText3)
Hot Topics


 Python vs. C : Applications and Use Cases Compared
Apr 12, 2025 am 12:01 AM
Python vs. C : Applications and Use Cases Compared
Apr 12, 2025 am 12:01 AM
Python is suitable for data science, web development and automation tasks, while C is suitable for system programming, game development and embedded systems. Python is known for its simplicity and powerful ecosystem, while C is known for its high performance and underlying control capabilities.
 How Much Python Can You Learn in 2 Hours?
Apr 09, 2025 pm 04:33 PM
How Much Python Can You Learn in 2 Hours?
Apr 09, 2025 pm 04:33 PM
You can learn the basics of Python within two hours. 1. Learn variables and data types, 2. Master control structures such as if statements and loops, 3. Understand the definition and use of functions. These will help you start writing simple Python programs.
 Python: Games, GUIs, and More
Apr 13, 2025 am 12:14 AM
Python: Games, GUIs, and More
Apr 13, 2025 am 12:14 AM
Python excels in gaming and GUI development. 1) Game development uses Pygame, providing drawing, audio and other functions, which are suitable for creating 2D games. 2) GUI development can choose Tkinter or PyQt. Tkinter is simple and easy to use, PyQt has rich functions and is suitable for professional development.
 The 2-Hour Python Plan: A Realistic Approach
Apr 11, 2025 am 12:04 AM
The 2-Hour Python Plan: A Realistic Approach
Apr 11, 2025 am 12:04 AM
You can learn basic programming concepts and skills of Python within 2 hours. 1. Learn variables and data types, 2. Master control flow (conditional statements and loops), 3. Understand the definition and use of functions, 4. Quickly get started with Python programming through simple examples and code snippets.
 Python vs. C : Learning Curves and Ease of Use
Apr 19, 2025 am 12:20 AM
Python vs. C : Learning Curves and Ease of Use
Apr 19, 2025 am 12:20 AM
Python is easier to learn and use, while C is more powerful but complex. 1. Python syntax is concise and suitable for beginners. Dynamic typing and automatic memory management make it easy to use, but may cause runtime errors. 2.C provides low-level control and advanced features, suitable for high-performance applications, but has a high learning threshold and requires manual memory and type safety management.
 Python: Exploring Its Primary Applications
Apr 10, 2025 am 09:41 AM
Python: Exploring Its Primary Applications
Apr 10, 2025 am 09:41 AM
Python is widely used in the fields of web development, data science, machine learning, automation and scripting. 1) In web development, Django and Flask frameworks simplify the development process. 2) In the fields of data science and machine learning, NumPy, Pandas, Scikit-learn and TensorFlow libraries provide strong support. 3) In terms of automation and scripting, Python is suitable for tasks such as automated testing and system management.
 Python and Time: Making the Most of Your Study Time
Apr 14, 2025 am 12:02 AM
Python and Time: Making the Most of Your Study Time
Apr 14, 2025 am 12:02 AM
To maximize the efficiency of learning Python in a limited time, you can use Python's datetime, time, and schedule modules. 1. The datetime module is used to record and plan learning time. 2. The time module helps to set study and rest time. 3. The schedule module automatically arranges weekly learning tasks.
 Python: The Power of Versatile Programming
Apr 17, 2025 am 12:09 AM
Python: The Power of Versatile Programming
Apr 17, 2025 am 12:09 AM
Python is highly favored for its simplicity and power, suitable for all needs from beginners to advanced developers. Its versatility is reflected in: 1) Easy to learn and use, simple syntax; 2) Rich libraries and frameworks, such as NumPy, Pandas, etc.; 3) Cross-platform support, which can be run on a variety of operating systems; 4) Suitable for scripting and automation tasks to improve work efficiency.
