
 Backend Development
Python Tutorial
Try natural language data analysis with Streamlit in Snowflake (SiS)
Backend Development
Python Tutorial
Try natural language data analysis with Streamlit in Snowflake (SiS)
Try natural language data analysis with Streamlit in Snowflake (SiS)

Introduction
Snowflake has released an LLM assistant feature called Snowflake Copilot as a preview feature. With Snowflake Copilot, you can analyze table data using natural language.
On the other hand, Streamlit in Snowflake (SiS) allows you to easily incorporate generative AI and securely access table data. This made me think: could we create a more proactive natural language data analysis tool? So, I developed an app that can analyze and visualize data using natural language.
Note: This post represents my personal views and not those of Snowflake.
Feature Overview
Goals
- Usable by business users unfamiliar with SQL
- Ability to select DB / schema / table via mouse operations for analysis
- Capable of analyzing with very ambiguous natural language queries
Actual Screenshots (Excerpts)
The following are excerpts from analysis results using Cortex LLM (snowflake-arctic).

Note: We used this wine quality dataset.
Feature List
- Select Cortex LLM for analysis
- Choose DB / schema / table for analysis
- Display column information and sample data of the selected table
- Analysis using natural language input from users
- Automatic SQL generation for analysis
- Automatic execution of generated SQL
- Display of SQL query execution results
- Data insights provided by Cortex LLM
- Data visualization
- Appropriate graph selection and display by Cortex LLM
- Final data interpretation by Cortex LLM
Operating Conditions
- Snowflake account with access to Cortex LLM
- snowflake-ml-python 1.1.2 or later
Precautions
- Be cautious when using large datasets as no data limit is set
- Large result sets from generated SQL queries may take time to process
- Large result sets may cause LLM token limit errors
Source Code
from snowflake.snowpark.context import get_active_session
import streamlit as st
from snowflake.cortex import Complete as CompleteText
import snowflake.snowpark.functions as F
import pandas as pd
import numpy as np
import json
import plotly.express as px
# Get current session
session = get_active_session()
# Application title
st.title("Natural Language Data Analysis App")
# Cortex LLM settings
st.sidebar.title("Cortex LLM Settings")
lang_model = st.sidebar.radio("Select the language model you want to use",
("snowflake-arctic", "reka-flash", "reka-core",
"mistral-large2", "mistral-large", "mixtral-8x7b", "mistral-7b",
"llama3.1-405b", "llama3.1-70b", "llama3.1-8b",
"llama3-70b", "llama3-8b", "llama2-70b-chat",
"jamba-instruct", "gemma-7b")
)
# Function to escape column names
def escape_column_name(name):
return f'"{name}"'
# Function to get table information
def get_table_info(database, schema, table):
# Get column information
columns = session.sql(f"DESCRIBE TABLE {database}.{schema}.{table}").collect()
# Create DataFrame
column_df = pd.DataFrame(columns)
# Get row count
row_count = session.sql(f"SELECT COUNT(*) as count FROM {database}.{schema}.{table}").collect()[0]['COUNT']
# Get sample data
sample_data = session.sql(f"SELECT * FROM {database}.{schema}.{table} LIMIT 5").collect()
sample_df = pd.DataFrame(sample_data)
return column_df, row_count, sample_df
# Data analysis function
def analyze(df, query):
st.subheader("Result Analysis")
# Display basic statistical information
st.subheader("Basic Statistics")
st.write(df.describe())
# Use AI for data analysis
analysis_prompt = f"""
Based on the following dataframe and original question, please perform data analysis.
Concisely explain in English the insights, trends, and anomalies derived from the data.
If possible, please also mention the following points:
1. Data distribution and characteristics
2. Presence of abnormal values or outliers
3. Correlations between columns (if there are multiple numeric columns)
4. Time-series trends (if there is date or time data)
5. Category-specific features (if data can be divided by categories)
Dataframe:
{df.to_string()}
Original question:
{query}
"""
analysis = CompleteText(lang_model, analysis_prompt)
st.write(analysis)
# Data visualization function
def smart_data_visualization(df):
st.subheader("Smart Data Visualization")
if df.empty:
st.warning("The dataframe is empty. There is no data to visualize.")
return
# Request AI for graph suggestion
columns_info = "\n".join([f"{col} - type: {df[col].dtype}" for col in df.columns])
sample_data = df.head().to_string()
visualization_prompt = f"""
Analyze the information of the following dataframe and suggest the most appropriate graph type and the columns to use for its x-axis and y-axis.
Consider the characteristics of the data to ensure a meaningful visualization.
Column information:
{columns_info}
Sample data:
{sample_data}
Please provide only the following JSON data format as your response:
{{
"graph_type": "One of: scatter plot, bar chart, line chart, histogram, box plot",
"x_axis": "Column name to use for x-axis",
"y_axis": "Column name to use for y-axis (if applicable)",
"explanation": "Brief explanation of the selection reason"
}}
"""
ai_suggestion = CompleteText(lang_model, visualization_prompt)
try:
suggestion = json.loads(ai_suggestion)
graph_type = suggestion['graph_type']
x_axis = suggestion['x_axis']
y_axis = suggestion.get('y_axis') # y-axis might not be needed in some cases
explanation = suggestion['explanation']
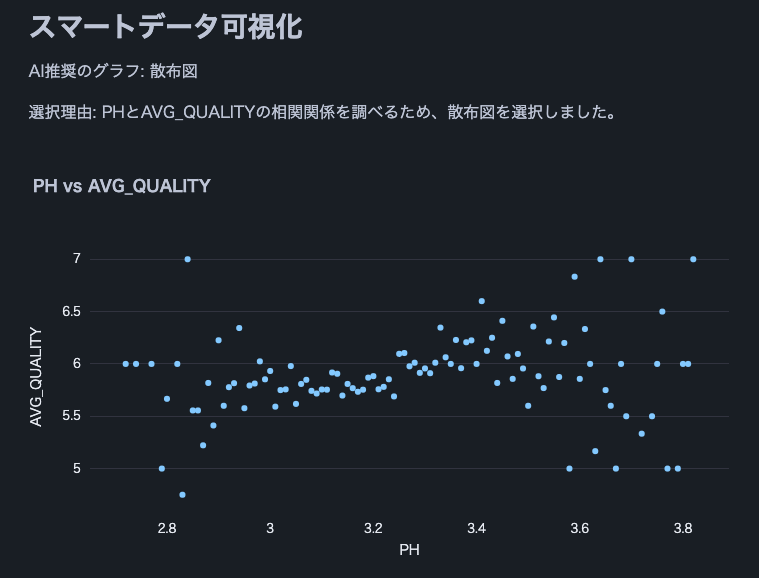
st.write(f"AI recommended graph: {graph_type}")
st.write(f"Selection reason: {explanation}")
if graph_type == "scatter plot":
fig = px.scatter(df, x=x_axis, y=y_axis, title=f"{x_axis} vs {y_axis}")
elif graph_type == "bar chart":
fig = px.bar(df, x=x_axis, y=y_axis, title=f"{y_axis} by {x_axis}")
elif graph_type == "line chart":
fig = px.line(df, x=x_axis, y=y_axis, title=f"{y_axis} over {x_axis}")
elif graph_type == "histogram":
fig = px.histogram(df, x=x_axis, title=f"Distribution of {x_axis}")
elif graph_type == "box plot":
fig = px.box(df, x=x_axis, y=y_axis, title=f"Distribution of {y_axis} by {x_axis}")
else:
st.warning(f"Unsupported graph type: {graph_type}")
return
st.plotly_chart(fig)
except json.JSONDecodeError:
st.error("Failed to parse AI suggestion. Please try again.")
except KeyError as e:
st.error(f"AI suggestion is missing necessary information: {str(e)}")
except Exception as e:
st.error(f"An error occurred while creating the graph: {str(e)}")
# AI interpretation of visualization
visualization_interpretation_prompt = f"""
Based on the following dataset and created graph, please provide a detailed interpretation of the data trends and characteristics in English.
Point out possible insights, patterns, anomalies, or areas that require additional analysis.
Dataset information:
Columns: {', '.join(df.columns)}
Number of rows: {len(df)}
Created graph:
Type: {graph_type}
X-axis: {x_axis}
Y-axis: {y_axis if y_axis else 'None'}
"""
ai_interpretation = CompleteText(lang_model, visualization_interpretation_prompt)
st.subheader("AI Interpretation of the Graph")
st.write(ai_interpretation)
# Function to handle cases where AI response is not just SQL query
def clean_sql_query(query):
# Remove leading and trailing whitespace
query = query.strip()
# If not starting with SQL keywords, remove everything up to the first SELECT
if not query.upper().startswith(('SELECT')):
keywords = ['SELECT']
for keyword in keywords:
if keyword in query.upper():
query = query[query.upper().index(keyword):]
break
return query
# Function for natural language querying of DB
def data_analysis_and_natural_language_query():
# Database selection
databases = session.sql("SHOW DATABASES").collect()
database_names = [row['name'] for row in databases]
selected_database = st.selectbox("Select a database", database_names)
if selected_database:
# Schema selection
schemas = session.sql(f"SHOW SCHEMAS IN DATABASE {selected_database}").collect()
schema_names = [row['name'] for row in schemas]
selected_schema = st.selectbox("Select a schema", schema_names)
if selected_schema:
# Table selection
tables = session.sql(f"SHOW TABLES IN {selected_database}.{selected_schema}").collect()
table_names = [row['name'] for row in tables]
selected_table = st.selectbox("Select a table", table_names)
if selected_table:
# Get table information
column_df, row_count, sample_df = get_table_info(selected_database, selected_schema, selected_table)
st.subheader("Table Information")
st.write(f"Table name: `{selected_database}.{selected_schema}.{selected_table}`")
st.write(f"Total rows: **{row_count:,}**")
st.subheader("Column Information")
st.dataframe(column_df)
st.subheader("Sample Data (showing only 5 rows)")
st.dataframe(sample_df)
# Stringify table information (for AI)
table_info = f"""
Table name: {selected_database}.{selected_schema}.{selected_table}
Total rows: {row_count}
Column information:
{column_df.to_string(index=False)}
Sample data:
{sample_df.to_string(index=False)}
"""
# Natural language input from user
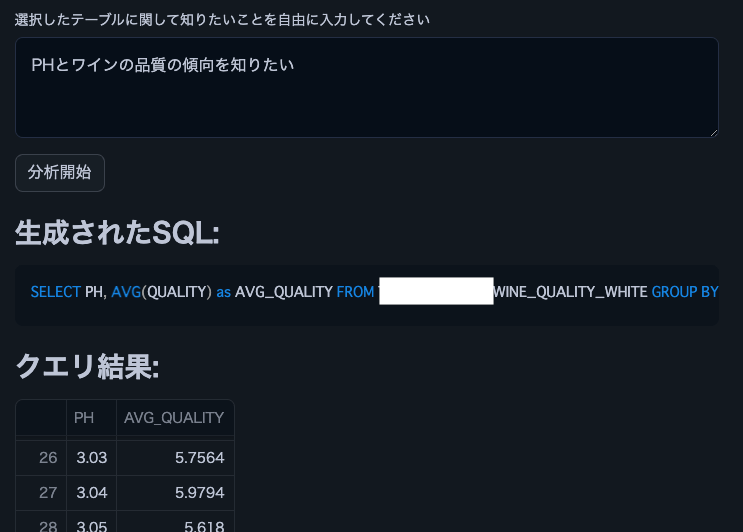
user_query = st.text_area("Enter what you want to know about the selected table")
if st.button("Start Analysis"):
if user_query:
# Use AI to generate SQL
prompt = f"""
Based on the following table information and question, please generate an appropriate SQL query.
Return only the generated SQL query without any additional response.
Table information:
{table_info}
Question: {user_query}
Notes:
- Follow Snowflake SQL syntax.
- Use aggregate functions to keep the query result size manageable.
- Use {selected_database}.{selected_schema}.{selected_table} as the table name.
"""
generated_sql = CompleteText(lang_model, prompt)
generated_sql = clean_sql_query(generated_sql)
st.subheader("Generated SQL:")
st.code(generated_sql, language='sql')
try:
# Execute the generated SQL
result = session.sql(generated_sql).collect()
df = pd.DataFrame(result)
st.subheader("Query Result:")
st.dataframe(df)
# Analyze results
analyze(df, user_query)
# Smart data visualization
smart_data_visualization(df)
except Exception as e:
st.error(f"An error occurred while executing the query: {str(e)}")
else:
st.warning("Please enter a question.")
# Execution part
data_analysis_and_natural_language_query()
Conclusion
The ability to easily analyze table data using natural language without SQL or Python knowledge could significantly broaden the scope of data utilization in enterprises for business users. By adding features like joining multiple tables or increasing the variety of visualization graphs, even more complex analyses can be performed. I encourage everyone to try implementing data analysis democratization using Streamlit in Snowflake.
Announcements
Snowflake What's New Updates on X
I'm sharing Snowflake's What's New updates on X. Please feel free to follow if you're interested!
English Version
Snowflake What's New Bot (English Version)
https://x.com/snow_new_en
Japanese Version
Snowflake What's New Bot (Japanese Version)
https://x.com/snow_new_jp
Change History
(20240914) Initial post
Original Japanese Article
https://zenn.dev/tsubasa_tech/articles/2608c820294860
The above is the detailed content of Try natural language data analysis with Streamlit in Snowflake (SiS). For more information, please follow other related articles on the PHP Chinese website!

Hot AI Tools

Undresser.AI Undress
AI-powered app for creating realistic nude photos

AI Clothes Remover
Online AI tool for removing clothes from photos.

Undress AI Tool
Undress images for free

Clothoff.io
AI clothes remover

Video Face Swap
Swap faces in any video effortlessly with our completely free AI face swap tool!

Hot Article
Hot Tools

Notepad++7.3.1
Easy-to-use and free code editor

SublimeText3 Chinese version
Chinese version, very easy to use

Zend Studio 13.0.1
Powerful PHP integrated development environment

Dreamweaver CS6
Visual web development tools

SublimeText3 Mac version
God-level code editing software (SublimeText3)
Hot Topics
 1673
1673
 14
1428
52
1333
25
1278
29
1257
24
14
1428
52
1333
25
1278
29
1257
24

 Python vs. C : Learning Curves and Ease of Use
Apr 19, 2025 am 12:20 AM
Python vs. C : Learning Curves and Ease of Use
Apr 19, 2025 am 12:20 AM
Python is easier to learn and use, while C is more powerful but complex. 1. Python syntax is concise and suitable for beginners. Dynamic typing and automatic memory management make it easy to use, but may cause runtime errors. 2.C provides low-level control and advanced features, suitable for high-performance applications, but has a high learning threshold and requires manual memory and type safety management.
 Learning Python: Is 2 Hours of Daily Study Sufficient?
Apr 18, 2025 am 12:22 AM
Learning Python: Is 2 Hours of Daily Study Sufficient?
Apr 18, 2025 am 12:22 AM
Is it enough to learn Python for two hours a day? It depends on your goals and learning methods. 1) Develop a clear learning plan, 2) Select appropriate learning resources and methods, 3) Practice and review and consolidate hands-on practice and review and consolidate, and you can gradually master the basic knowledge and advanced functions of Python during this period.
 Python vs. C : Exploring Performance and Efficiency
Apr 18, 2025 am 12:20 AM
Python vs. C : Exploring Performance and Efficiency
Apr 18, 2025 am 12:20 AM
Python is better than C in development efficiency, but C is higher in execution performance. 1. Python's concise syntax and rich libraries improve development efficiency. 2.C's compilation-type characteristics and hardware control improve execution performance. When making a choice, you need to weigh the development speed and execution efficiency based on project needs.
 Python vs. C : Understanding the Key Differences
Apr 21, 2025 am 12:18 AM
Python vs. C : Understanding the Key Differences
Apr 21, 2025 am 12:18 AM
Python and C each have their own advantages, and the choice should be based on project requirements. 1) Python is suitable for rapid development and data processing due to its concise syntax and dynamic typing. 2)C is suitable for high performance and system programming due to its static typing and manual memory management.
 Which is part of the Python standard library: lists or arrays?
Apr 27, 2025 am 12:03 AM
Which is part of the Python standard library: lists or arrays?
Apr 27, 2025 am 12:03 AM
Pythonlistsarepartofthestandardlibrary,whilearraysarenot.Listsarebuilt-in,versatile,andusedforstoringcollections,whereasarraysareprovidedbythearraymoduleandlesscommonlyusedduetolimitedfunctionality.
 Python: Automation, Scripting, and Task Management
Apr 16, 2025 am 12:14 AM
Python: Automation, Scripting, and Task Management
Apr 16, 2025 am 12:14 AM
Python excels in automation, scripting, and task management. 1) Automation: File backup is realized through standard libraries such as os and shutil. 2) Script writing: Use the psutil library to monitor system resources. 3) Task management: Use the schedule library to schedule tasks. Python's ease of use and rich library support makes it the preferred tool in these areas.
 Python for Scientific Computing: A Detailed Look
Apr 19, 2025 am 12:15 AM
Python for Scientific Computing: A Detailed Look
Apr 19, 2025 am 12:15 AM
Python's applications in scientific computing include data analysis, machine learning, numerical simulation and visualization. 1.Numpy provides efficient multi-dimensional arrays and mathematical functions. 2. SciPy extends Numpy functionality and provides optimization and linear algebra tools. 3. Pandas is used for data processing and analysis. 4.Matplotlib is used to generate various graphs and visual results.
 Python for Web Development: Key Applications
Apr 18, 2025 am 12:20 AM
Python for Web Development: Key Applications
Apr 18, 2025 am 12:20 AM
Key applications of Python in web development include the use of Django and Flask frameworks, API development, data analysis and visualization, machine learning and AI, and performance optimization. 1. Django and Flask framework: Django is suitable for rapid development of complex applications, and Flask is suitable for small or highly customized projects. 2. API development: Use Flask or DjangoRESTFramework to build RESTfulAPI. 3. Data analysis and visualization: Use Python to process data and display it through the web interface. 4. Machine Learning and AI: Python is used to build intelligent web applications. 5. Performance optimization: optimized through asynchronous programming, caching and code
