

Movie Dataset Exploration and Visualization

Introduction
Practice makes perfect.
Something that has a lot in common with being a data scientist. Theory is only one aspect of the equation; the most crucial aspect is putting theory into practice. I will make an effort to record today's entire process of developing my capstone project, which will involve studying a movie dataset.
These are the objectives:
Objective:
- Download a movie dataset from Kaggle or retrieve it using the TMDb API.
- Explore various aspects such as movie genres, ratings, director popularity, and release year trends.
- Create dashboards that visualize these trends and optionally recommend movies based on user preferences.
1. Data Collection
I decided to use Kaggle to find my dataset.It is crucial to keep in mind the crucial variables you will want for the dataset you are working with. Importantly, my dataset ought to include the following: trends in release year, popularity of directors, ratings, and movie genres. As a result, I must make sure the dataset I choose has the following, at the very least.
My dataset was located on Kaggle, and I'll provide the link below. You can obtain the CSV version of the file by downloading the dataset, unzipping it, and extracting it. You can look over it to comprehend what you already have and to truly realize what kinds of insights you hope to obtain from the data you will be examining.
2. Describing the data
First, we must import the required libraries and load the necessary data. I'm using the Python programming language and Jupyter Notebooks for my project so that I can write and see my code more efficiently.
You will import the libraries that we will be using and load the data as shown below.
We will then run the following command to get more details about our dataset.
data.head() # dispalys the first rows of the dataset.
data.tail() # displays the last rows of the dataset.
data.shape # Shows the total number of rows and columns.
len(data.columns)  # Shows the total number of columns.
data.columns # Describes different column names.
data.dtypes # Describes different data types.
We now know what the dataset comprises and the insights we hope to extract after obtaining all the descriptions we require. Example: Using my dataset, I wish to investigate patterns in the popularity of directors, ratings distribution, and movie genres. I also want to suggest movies depending on user-selected preferences, such as preferred directors and genres.
3. Data Cleaning
This phase involves finding any null values and removing them. In order to move on with data visualization, we will also examine our dataset for duplicates and remove any that we find. To do this, we'll run the code that follows:
1. data['show_id'].value_counts().sum() # Checks for the total number of rows in my dataset
2. data.isna().sum() # Checks for null values(I found null values in director, cast and country columns)
3. data[['director', 'cast', 'country']] = data[['director', 'cast', 'country']].replace(np.nan, "Unknown ") # Fill null values with unknown.
We will then drop the rows with unknown values and confirm we have dropped all of them. We will also check the number of rows remaining that have cleaned data.
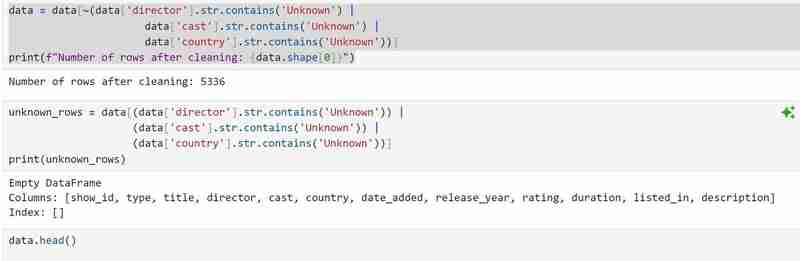
The code that follows looks for unique characteristics and duplicates. Although there are no duplicates in my dataset, you might still need to utilize it in case future datasets do.
data.duplicated().sum() # Checks for duplicates
data.nunique() # Checks for unique features
data.info # Confirms if nan values are present and also shows datatypes.
My date/time data type is an object and I would like for it to be in the proper date/time format so I used
data['date_added']=data['date_added'].astype('datetime64[ms]')to convert it to the proper format.
4. Data Visualization
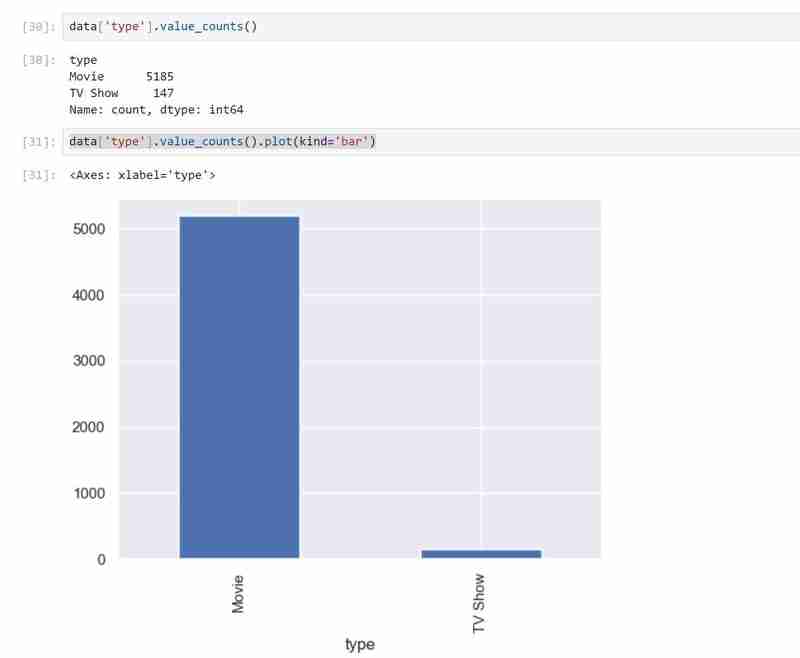
My dataset has two types of variables namely the TV shows and Movies in the types and I used a bar graph to present the categorical data with the values that they represent.

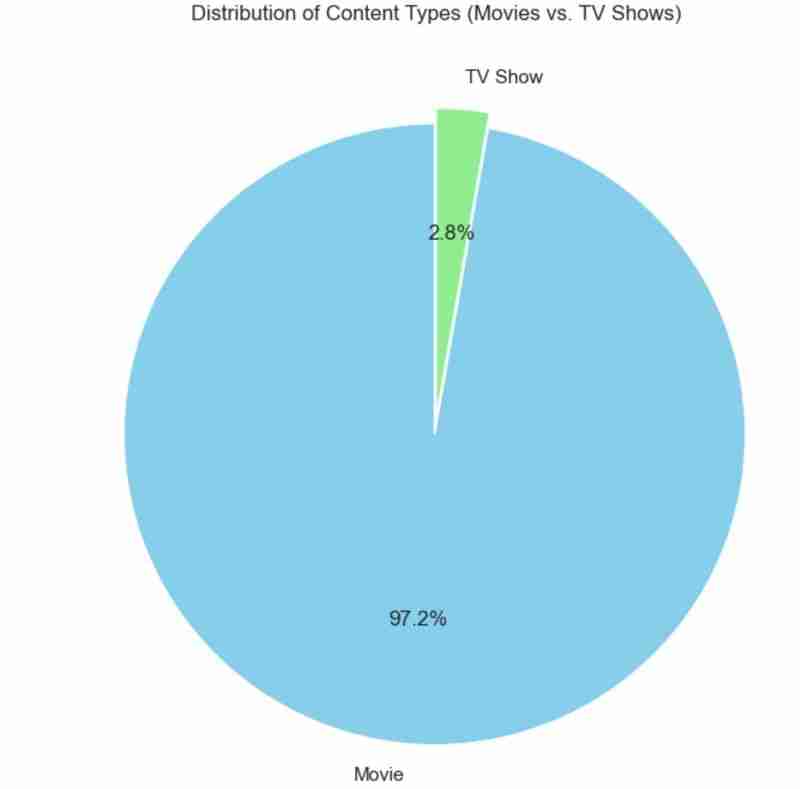
I also used a pie chart to represent the same as above. The code used is as follows and the outcome expected shown below.
## Pie chart display
plt.figure(figsize=(8, 8))
data['type'].value_counts().plot(
    kind='pie',
    autopct='%1.1f%%',
    colors=['skyblue', 'lightgreen'],
    startangle=90,
    explode=(0.05, 0)
)
plt.title('Distribution of Content Types (Movies vs. TV Shows)')
plt.ylabel('')
plt.show()
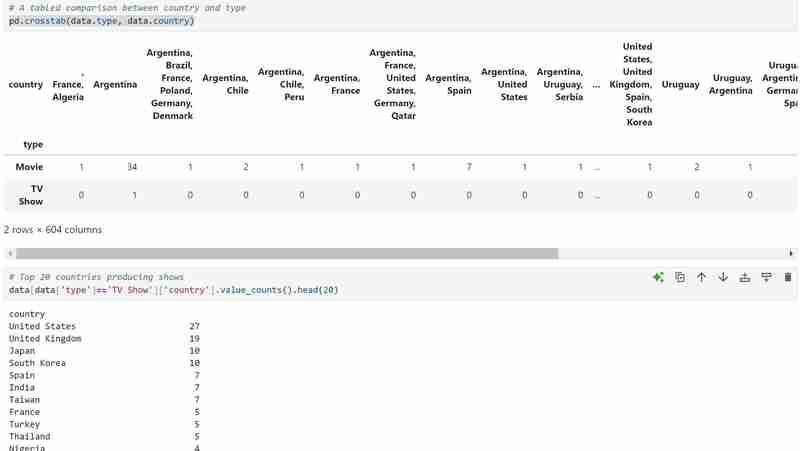
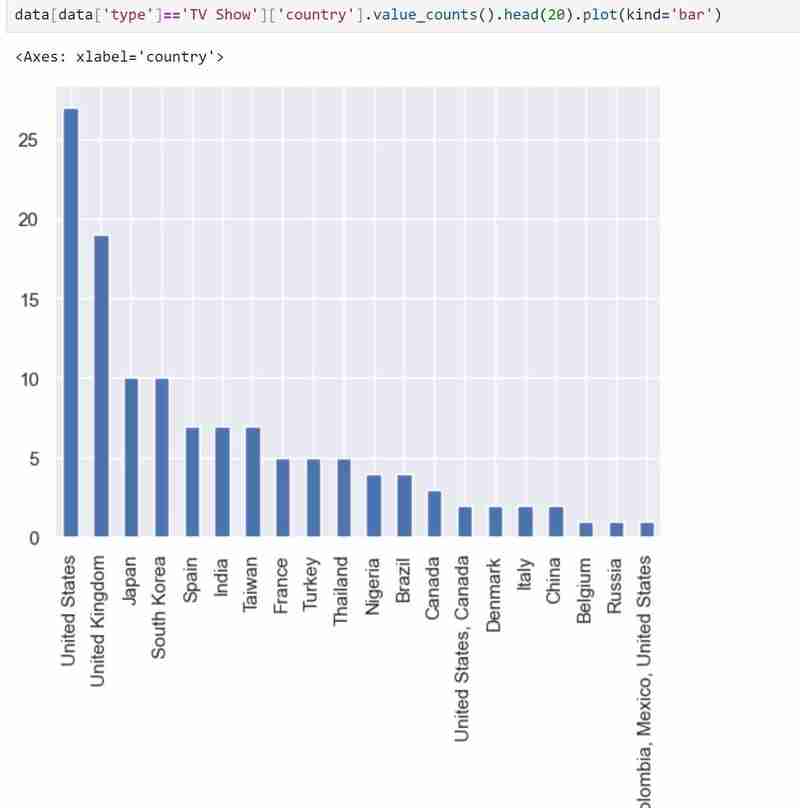
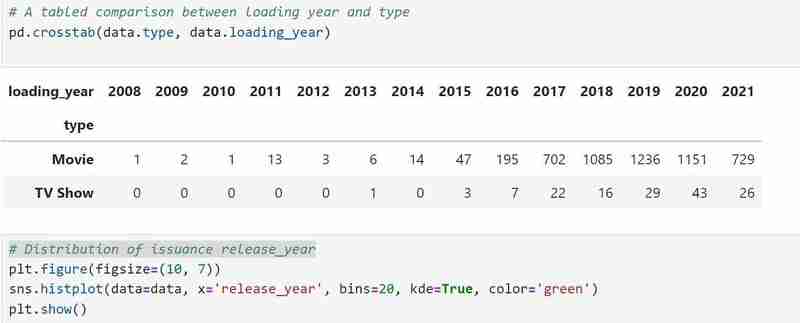
- I then did a tabled comparison using pd.crosstab(data.type, data.country) to create a tabled comparison of the types based on release dates, countries, and other factors (you can try changing the columns in the code independently). Below are the code to use and the expected comparison. I also checked the first 20 countries leading in the production of Tv Shows and and visualized them in a bar graph.You can copy the code in the image and ensure the outcome is almost similar to mine.
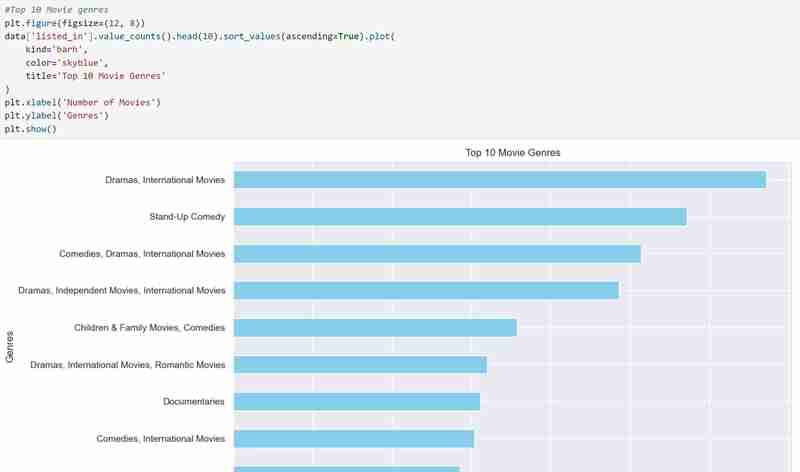
- I then checked for the top 10 movie genre as shown below. You can also use the code to check for TV shows. Just substitute with proper variable names.
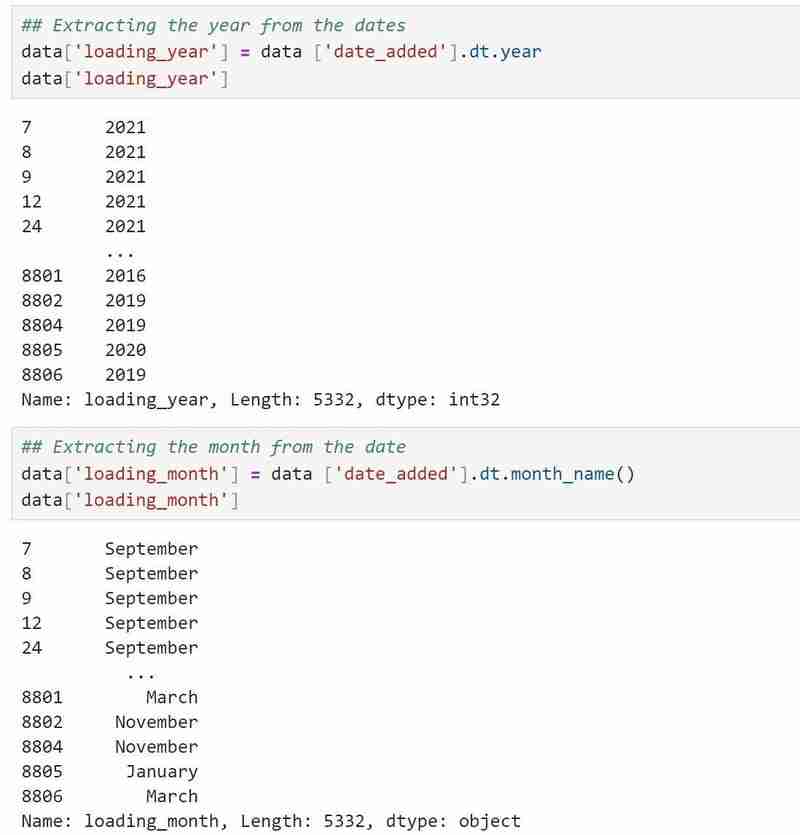
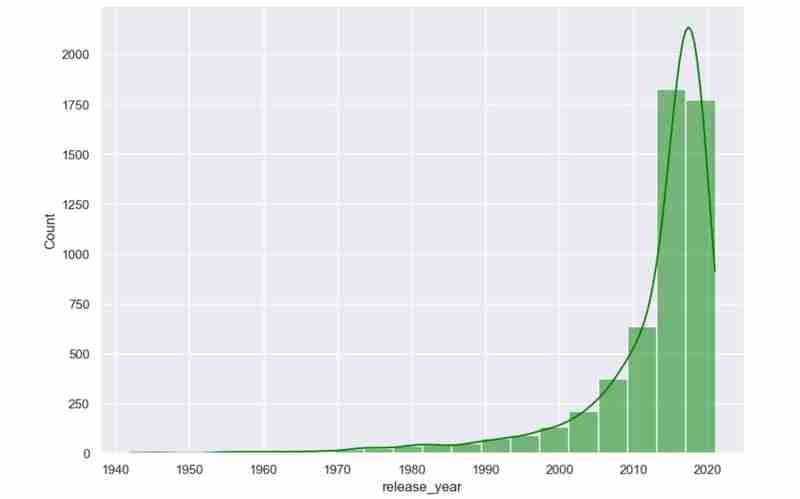
- I extracted months and years separately from the dates provided so that I could visualize some histogram plots over the years.
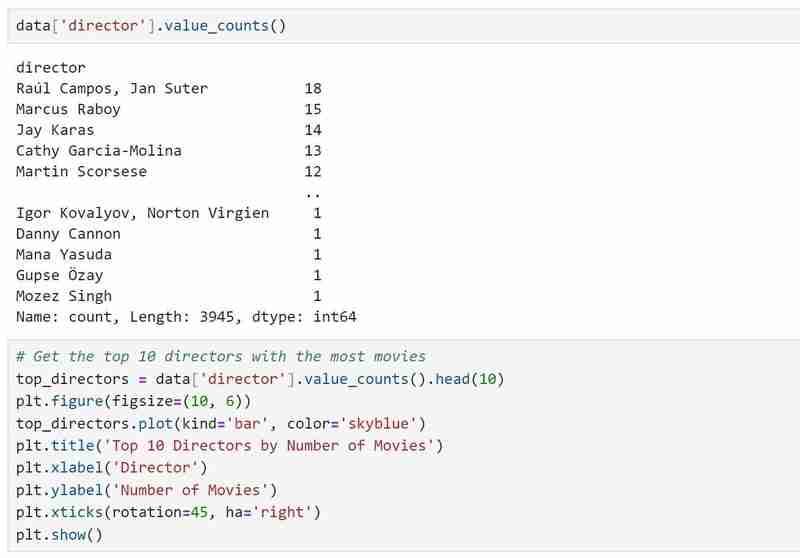
- Checked for the top 10 directors with the most movies and compared them using a bar graph.
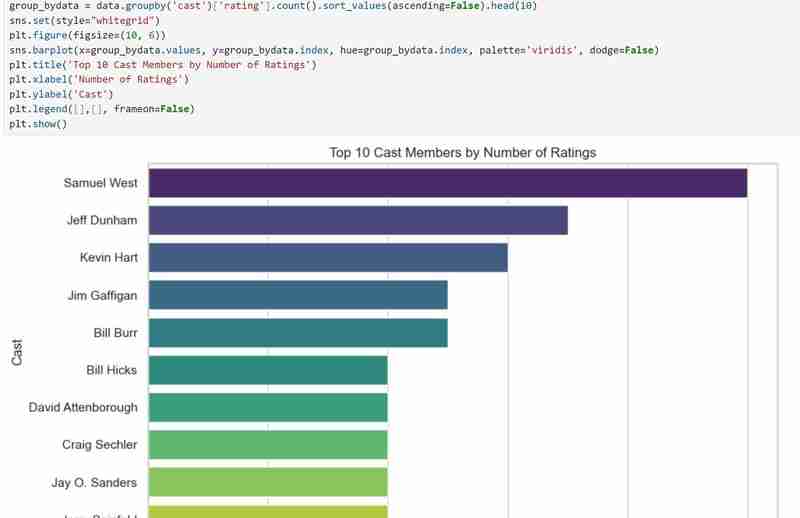
- Checked for the cast with the highest rating and visualized them.
5. Recommendation System
I then built a recommendation system that takes in genre or director's name as input and produces a list of movies as per the user's preference. If the input cannot be matched by the algorithm then the user is notified.
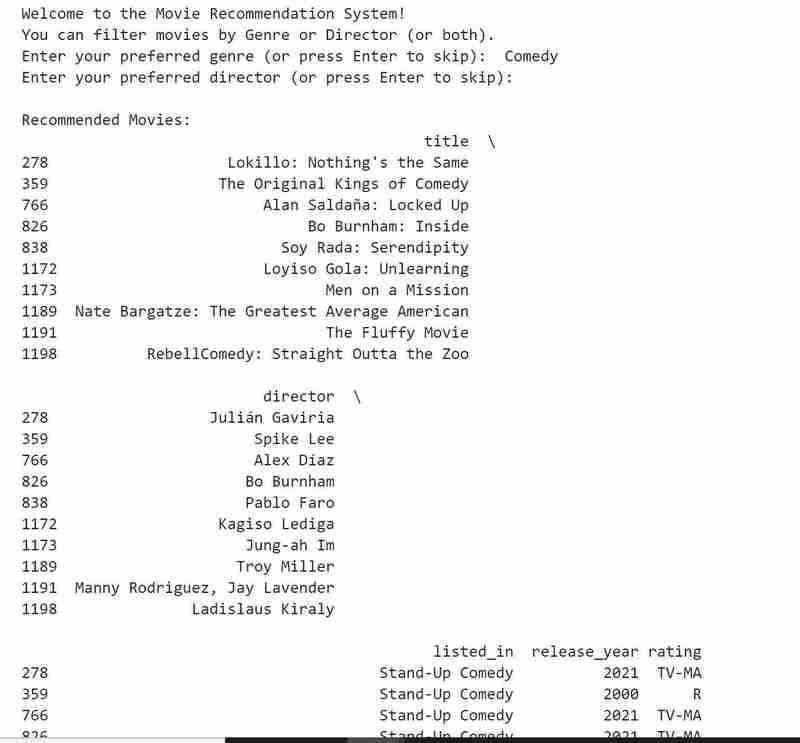
The code for the above is as follows:
def recommend_movies(genre=None, director=None):
    recommendations = data
    if genre:
        recommendations = recommendations[recommendations['listed_in'].str.contains(genre, case=False, na=False)]
    if director:
        recommendations = recommendations[recommendations['director'].str.contains(director, case=False, na=False)]
    if not recommendations.empty:
        return recommendations[['title', 'director', 'listed_in', 'release_year', 'rating']].head(10)
    else:
        return "No movies found matching your preferences."
print("Welcome to the Movie Recommendation System!")
print("You can filter movies by Genre or Director (or both).")
user_genre = input("Enter your preferred genre (or press Enter to skip): ")
user_director = input("Enter your preferred director (or press Enter to skip): ")
recommendations = recommend_movies(genre=user_genre, director=user_director)
print("\nRecommended Movies:")
print(recommendations)
Conclusion
My goals were achieved, and I had a great time taking on this challenge since it helped me realize that, even though learning is a process, there are days when I succeed and fail. This was definitely a success. Here, we celebrate victories as well as defeats since, in the end, each teach us something. Do let me know if you attempt this.
Till next time!
Note!!
The code is in my GitHub:
https://github.com/MichelleNjeri-scientist/Movie-Dataset-Exploration-and-Visualization
The Kaggle dataset is:
https://www.kaggle.com/datasets/shivamb/netflix-shows
The above is the detailed content of Movie Dataset Exploration and Visualization. For more information, please follow other related articles on the PHP Chinese website!

Hot AI Tools

Undresser.AI Undress
AI-powered app for creating realistic nude photos

AI Clothes Remover
Online AI tool for removing clothes from photos.

Undress AI Tool
Undress images for free

Clothoff.io
AI clothes remover

Video Face Swap
Swap faces in any video effortlessly with our completely free AI face swap tool!

Hot Article
Hot Tools

Notepad++7.3.1
Easy-to-use and free code editor

SublimeText3 Chinese version
Chinese version, very easy to use

Zend Studio 13.0.1
Powerful PHP integrated development environment

Dreamweaver CS6
Visual web development tools

SublimeText3 Mac version
God-level code editing software (SublimeText3)
Hot Topics


 How to solve the permissions problem encountered when viewing Python version in Linux terminal?
Apr 01, 2025 pm 05:09 PM
How to solve the permissions problem encountered when viewing Python version in Linux terminal?
Apr 01, 2025 pm 05:09 PM
Solution to permission issues when viewing Python version in Linux terminal When you try to view Python version in Linux terminal, enter python...
 How to avoid being detected by the browser when using Fiddler Everywhere for man-in-the-middle reading?
Apr 02, 2025 am 07:15 AM
How to avoid being detected by the browser when using Fiddler Everywhere for man-in-the-middle reading?
Apr 02, 2025 am 07:15 AM
How to avoid being detected when using FiddlerEverywhere for man-in-the-middle readings When you use FiddlerEverywhere...
 How to efficiently copy the entire column of one DataFrame into another DataFrame with different structures in Python?
Apr 01, 2025 pm 11:15 PM
How to efficiently copy the entire column of one DataFrame into another DataFrame with different structures in Python?
Apr 01, 2025 pm 11:15 PM
When using Python's pandas library, how to copy whole columns between two DataFrames with different structures is a common problem. Suppose we have two Dats...
 How does Uvicorn continuously listen for HTTP requests without serving_forever()?
Apr 01, 2025 pm 10:51 PM
How does Uvicorn continuously listen for HTTP requests without serving_forever()?
Apr 01, 2025 pm 10:51 PM
How does Uvicorn continuously listen for HTTP requests? Uvicorn is a lightweight web server based on ASGI. One of its core functions is to listen for HTTP requests and proceed...
 How to teach computer novice programming basics in project and problem-driven methods within 10 hours?
Apr 02, 2025 am 07:18 AM
How to teach computer novice programming basics in project and problem-driven methods within 10 hours?
Apr 02, 2025 am 07:18 AM
How to teach computer novice programming basics within 10 hours? If you only have 10 hours to teach computer novice some programming knowledge, what would you choose to teach...
 How to solve permission issues when using python --version command in Linux terminal?
Apr 02, 2025 am 06:36 AM
How to solve permission issues when using python --version command in Linux terminal?
Apr 02, 2025 am 06:36 AM
Using python in Linux terminal...
 How to handle comma-separated list query parameters in FastAPI?
Apr 02, 2025 am 06:51 AM
How to handle comma-separated list query parameters in FastAPI?
Apr 02, 2025 am 06:51 AM
Fastapi ...
 How to get news data bypassing Investing.com's anti-crawler mechanism?
Apr 02, 2025 am 07:03 AM
How to get news data bypassing Investing.com's anti-crawler mechanism?
Apr 02, 2025 am 07:03 AM
Understanding the anti-crawling strategy of Investing.com Many people often try to crawl news data from Investing.com (https://cn.investing.com/news/latest-news)...
