

使用DBMS_HPROF包收集PL/SQL性能信息

DBMS_HPROF包是oracle 11g出现的工具,是DBMS_PROFILER和DBMS_TRACE的综合.这里简单演示如何使用DBMS_HPROF包来分析存储过程性能信
DBMS_HPROF包是Oracle 11g出现的工具,是DBMS_PROFILER和DBMS_TRACE的综合.
这里简单演示如何使用DBMS_HPROF包来分析存储过程性能信息.
首先我们需要执行一个脚本来生成保存相关信息的表.
使用SYS用户执行$ORACLE_HOME/rdbms/admin/dbmshptab.sql
然后创建directory,
CREATE DIRECTORY LOG_FILE_DIR AS '/home/oracle';
先用SCOTT用户创建一个用于测试的存储过程insert_emp.
23:58:57 @ORCL> conn scott/tiger@orcl
Connected.
23:59:35 SCOTT@orcl> CREATE OR REPLACE PROCEDURE insert_emp(pempno number, pename varchar2) IS
23:59:45 2 stmt VARCHAR2(2000);
23:59:45 3 BEGIN
23:59:45 4 stmt := 'INSERT INTO emp_bak '
23:59:45 5 || '(EMPNO,ENAME) '
23:59:45 6 || 'SELECT :EMPNO,:ENAME'
23:59:45 7 || ' FROM DUAL';
23:59:45 8 dbms_output.put_line(stmt);
23:59:45 9 EXECUTE IMMEDIATE stmt
23:59:45 10 USING pempno, pename;
23:59:45 11 END insert_emp;
23:59:46 12 /
Procedure created.
Elapsed: 00:00:00.44
这里演示是在SYS用户下进行,如果要到指定用户执行,需要将DBMS_HPROF包的执行权限以及目录的读写权限赋予给该用户.
收集刚建立的存储过程的性能指标
00:06:11 SYS@orcl> DECLARE
00:10:42 2 v_runid dbmshp_runs.runid%TYPE;
00:10:42 3 v_plshprof_dir all_directories.directory_name%TYPE := 'LOG_FILE_DIR';
00:10:42 4 v_plshprof_file VARCHAR2(30) := 'insert_emp';
00:10:42 5 BEGIN
00:10:42 6 -- Start the profiling session
00:10:42 7 dbms_hprof.start_profiling(v_plshprof_dir, v_plshprof_file);
00:10:42 8 scott.insert_emp(9990,'Cryking!');
00:10:42 9 -- Stop the profiling session
00:10:42 10 dbms_hprof.stop_profiling;
00:10:42 11 -- Analyze the raw output and create the table data
00:10:42 12 v_runid := dbms_hprof.analyze(v_plshprof_dir, v_plshprof_file);
00:10:42 13 DBMS_OUTPUT.PUT_LINE('This Run: ' || to_char(v_runid));
00:10:42 14 END;
00:10:42 15 /
INSERT INTO emp_bak (EMPNO,ENAME) SELECT :EMPNO,:ENAME FROM DUAL
This Run: 1
PL/SQL procedure successfully completed.
Elapsed: 00:00:00.26
执行完后,会在对应目录生成一个insert_emp的文件,直接查看文件的话,内容很凌乱也很简短,如下:
P#! PL/SQL Timer Started
P#C PLSQL."SCOTT"."INSERT_EMP"::7."INSERT_EMP"#762ba075453b8b0d #1
P#X 1331
P#C PLSQL."SYS"."DBMS_OUTPUT"::11."PUT_LINE"#5892e4d73b579470 #109
P#X 4
P#C PLSQL."SYS"."DBMS_OUTPUT"::11."PUT"#5892e4d73b579470 #77
P#X 220
P#R
P#X 2
P#C PLSQL."SYS"."DBMS_OUTPUT"::11."NEW_LINE"#980980e97e42f8ec #117
P#X 4
P#R
P#X 3
P#R
P#X 83
P#C SQL."SCOTT"."INSERT_EMP"::7."__dyn_sql_exec_line9" #9
P#X 39858
P#R
P#X 14
P#R
P#C PLSQL."SYS"."DBMS_HPROF"::11."STOP_PROFILING"#980980e97e42f8ec #59
P#R
P#! PL/SQL Timer Stopped
这里需要使用工具plshprof对其进行分析,如下:
[oracle@oracleserver ~]$ plshprof insert_emp
PLSHPROF: Oracle Database 11g Enterprise Edition Release 11.2.0.1.0 - Production
[6 symbols processed]
[Report written to 'insert_emp.html']
[oracle@oracleserver ~]$ ls *.html
insert_emp_2c.html insert_emp_fn.html insert_emp_mf.html insert_emp_nsf.html insert_emp_tc.html insert_emp_ts.html
insert_emp_2f.html insert_emp.html insert_emp_ms.html insert_emp_nsp.html insert_emp_td.html
insert_emp_2n.html insert_emp_md.html insert_emp_nsc.html insert_emp_pc.html insert_emp_tf.html
然后我们再查看文件insert_emp.html的内容,如下:
PL/SQL Elapsed Time (microsecs) Analysis
41519 microsecs (elapsed time) & 6 function calls
The PL/SQL Hierarchical Profiler produces a collection of reports that
present information derived from the profiler's output log in a variety
of formats. The following reports have been found to be the most generally
useful as starting points for browsing:
-
Function Elapsed Time (microsecs) Data sorted by Total Subtree Elapsed Time (microsecs)
-
Function Elapsed Time (microsecs) Data sorted by Total Function Elapsed Time (microsecs)
In addition, the following reports are also available:
-
Function Elapsed Time (microsecs) Data sorted by Function Name
-
Function Elapsed Time (microsecs) Data sorted by Total Descendants Elapsed Time (microsecs)
-
Function Elapsed Time (microsecs) Data sorted by Total Function Call Count
-
Function Elapsed Time (microsecs) Data sorted by Mean Subtree Elapsed Time (microsecs)
-
Function Elapsed Time (microsecs) Data sorted by Mean Function Elapsed Time (microsecs)
-
Function Elapsed Time (microsecs) Data sorted by Mean Descendants Elapsed Time (microsecs)
-
Module Elapsed Time (microsecs) Data sorted by Total Function Elapsed Time (microsecs)
.......通过浏览器查看,我们可以点击各个链接,查看,如点击Function Elapsed Time (microsecs) Data sorted by Total Subtree Elapsed Time (microsecs)后,结果如下图:

从图可知,函数最耗时的语句为SCOTT.INSERT_EMO._dyn_sql_exec_line9(即为执行动态sql那一行),耗时39858微秒,整个函数共耗时41519微秒.
还可以点击Function Name列查看更详细的内容.
PS:其实生成的HTML大部分信息都是来自dbmshp_function_info和dbmshp_parent_child_info表.
,


Hot AI Tools

Undresser.AI Undress
AI-powered app for creating realistic nude photos

AI Clothes Remover
Online AI tool for removing clothes from photos.

Undress AI Tool
Undress images for free

Clothoff.io
AI clothes remover

Video Face Swap
Swap faces in any video effortlessly with our completely free AI face swap tool!

Hot Article
Hot Tools

Notepad++7.3.1
Easy-to-use and free code editor

SublimeText3 Chinese version
Chinese version, very easy to use

Zend Studio 13.0.1
Powerful PHP integrated development environment

Dreamweaver CS6
Visual web development tools

SublimeText3 Mac version
God-level code editing software (SublimeText3)
Hot Topics


 When might a full table scan be faster than using an index in MySQL?
Apr 09, 2025 am 12:05 AM
When might a full table scan be faster than using an index in MySQL?
Apr 09, 2025 am 12:05 AM
Full table scanning may be faster in MySQL than using indexes. Specific cases include: 1) the data volume is small; 2) when the query returns a large amount of data; 3) when the index column is not highly selective; 4) when the complex query. By analyzing query plans, optimizing indexes, avoiding over-index and regularly maintaining tables, you can make the best choices in practical applications.
 Can I install mysql on Windows 7
Apr 08, 2025 pm 03:21 PM
Can I install mysql on Windows 7
Apr 08, 2025 pm 03:21 PM
Yes, MySQL can be installed on Windows 7, and although Microsoft has stopped supporting Windows 7, MySQL is still compatible with it. However, the following points should be noted during the installation process: Download the MySQL installer for Windows. Select the appropriate version of MySQL (community or enterprise). Select the appropriate installation directory and character set during the installation process. Set the root user password and keep it properly. Connect to the database for testing. Note the compatibility and security issues on Windows 7, and it is recommended to upgrade to a supported operating system.
 Explain InnoDB Full-Text Search capabilities.
Apr 02, 2025 pm 06:09 PM
Explain InnoDB Full-Text Search capabilities.
Apr 02, 2025 pm 06:09 PM
InnoDB's full-text search capabilities are very powerful, which can significantly improve database query efficiency and ability to process large amounts of text data. 1) InnoDB implements full-text search through inverted indexing, supporting basic and advanced search queries. 2) Use MATCH and AGAINST keywords to search, support Boolean mode and phrase search. 3) Optimization methods include using word segmentation technology, periodic rebuilding of indexes and adjusting cache size to improve performance and accuracy.
 MySQL: Simple Concepts for Easy Learning
Apr 10, 2025 am 09:29 AM
MySQL: Simple Concepts for Easy Learning
Apr 10, 2025 am 09:29 AM
MySQL is an open source relational database management system. 1) Create database and tables: Use the CREATEDATABASE and CREATETABLE commands. 2) Basic operations: INSERT, UPDATE, DELETE and SELECT. 3) Advanced operations: JOIN, subquery and transaction processing. 4) Debugging skills: Check syntax, data type and permissions. 5) Optimization suggestions: Use indexes, avoid SELECT* and use transactions.
 Difference between clustered index and non-clustered index (secondary index) in InnoDB.
Apr 02, 2025 pm 06:25 PM
Difference between clustered index and non-clustered index (secondary index) in InnoDB.
Apr 02, 2025 pm 06:25 PM
The difference between clustered index and non-clustered index is: 1. Clustered index stores data rows in the index structure, which is suitable for querying by primary key and range. 2. The non-clustered index stores index key values and pointers to data rows, and is suitable for non-primary key column queries.
 Can mysql and mariadb coexist
Apr 08, 2025 pm 02:27 PM
Can mysql and mariadb coexist
Apr 08, 2025 pm 02:27 PM
MySQL and MariaDB can coexist, but need to be configured with caution. The key is to allocate different port numbers and data directories to each database, and adjust parameters such as memory allocation and cache size. Connection pooling, application configuration, and version differences also need to be considered and need to be carefully tested and planned to avoid pitfalls. Running two databases simultaneously can cause performance problems in situations where resources are limited.
 The relationship between mysql user and database
Apr 08, 2025 pm 07:15 PM
The relationship between mysql user and database
Apr 08, 2025 pm 07:15 PM
In MySQL database, the relationship between the user and the database is defined by permissions and tables. The user has a username and password to access the database. Permissions are granted through the GRANT command, while the table is created by the CREATE TABLE command. To establish a relationship between a user and a database, you need to create a database, create a user, and then grant permissions.
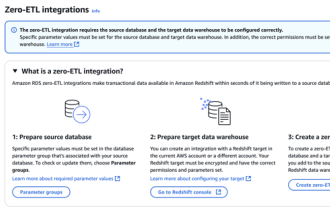 RDS MySQL integration with Redshift zero ETL
Apr 08, 2025 pm 07:06 PM
RDS MySQL integration with Redshift zero ETL
Apr 08, 2025 pm 07:06 PM
Data Integration Simplification: AmazonRDSMySQL and Redshift's zero ETL integration Efficient data integration is at the heart of a data-driven organization. Traditional ETL (extract, convert, load) processes are complex and time-consuming, especially when integrating databases (such as AmazonRDSMySQL) with data warehouses (such as Redshift). However, AWS provides zero ETL integration solutions that have completely changed this situation, providing a simplified, near-real-time solution for data migration from RDSMySQL to Redshift. This article will dive into RDSMySQL zero ETL integration with Redshift, explaining how it works and the advantages it brings to data engineers and developers.
