

Canvas implements high-order Bezier curve

This article mainly introduces the implementation of high-order Bezier curve (N-order Bezier curve generator) in canvas. The editor thinks it is quite good. Now I will share it with you and give you a reference. Let’s follow the editor to take a look, I hope it can help everyone.
Write first
Since the native Canvas only supports up to third-order Bezier curves, what should I do if I want to add multiple control points? (Even most complex curves can be simulated with third-order Bezier) At the same time, it is difficult for us to clearly understand the position of the Bezier control points very intuitively and how much the control points should be set to form the curve we want. . In order to solve the above two pain points, there seems to be no N-level solution (js version) in the community, so this time the author is very serious about open source bezierMaker.js!
bezierMaker.js theoretically supports the generation of N-order Bezier curves, and also provides a testing ground for developers to add and drag control points to ultimately generate a set of drawing animations. It is very intuitive for developers to know the different generation curves corresponding to control points at different positions.
If you like this work, welcome to Star. After all, stars are hard-earned. .
Project address: here✨✨✨
Why is a testing site needed?
When drawing a complex high-order Bezier curve, you cannot know the precise location of the control points of the curve you need. By simulating in the test field, the coordinate values of the control points can be obtained in real time. The obtained point coordinates can be converted into an object array and passed into the BezierMaker class to generate the target curve
Effect diagram
##Function
- ##[x] Any number of control points can be added to the test site
- [x] The test site supports displaying the formation animation of curve drawing
- [x] Control points can be freely dragged
- [x] The drawing of Bezier curves of order 3 and below uses native API
<script src="./bezierMaker.js"></script>
Draw
The above rendering is For the use of the test site, after you obtain the accurate coordinates of the control points through the test site, you can call bezierMaker.js to draw the curve directly.
/**
 * canvas canvas的dom对象
 * bezierCtrlNodesArr 控制点数组,包含x,y坐标
 * color 曲线颜色
 */
var canvas = document.getElementById('canvas')
//3阶之前采用原生方法实现
var arr0 = [{x:70,y:25},{x:24,y:51}]
var arr1 = [{x:233,y:225},{x:170,y:279},{x:240,y:51}]
var arr2 = [{x:23,y:225},{x:70,y:79},{x:40,y:51},{x:300, y:44}]
var arr3 = [{x:333,y:15},{x:70,y:79},{x:40,y:551},{x:170,y:279},{x:17,y:239}]
var arr4 = [{x:53,y:85},{x:170,y:279},{x:240,y:551},{x:70,y:79},{x:40,y:551},{x:170,y:279}]
var bezier0 = new BezierMaker(canvas, arr0, 'black')
var bezier1 = new BezierMaker(canvas, arr1, 'red')
var bezier2 = new BezierMaker(canvas, arr2, 'blue')
var bezier3 = new BezierMaker(canvas, arr3, 'yellow')
var bezier4 = new BezierMaker(canvas, arr4, 'green')
bezier0.drawBezier()
bezier1.drawBezier()
bezier2.drawBezier()
bezier3.drawBezier()
bezier4.drawBezier()Drawing results
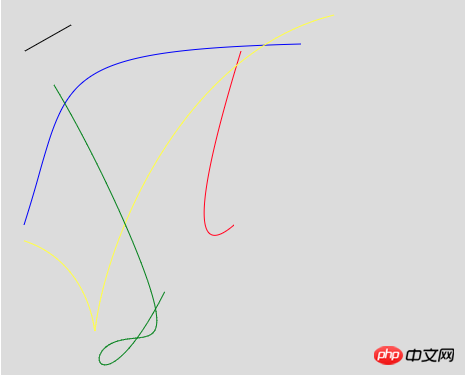 When there are less than 3 control points, the native API interface will be used. . When there are more than 2 control points, the function we implement will be used to draw the points.
Drawing Bezier curve
The core point of drawing Bezier curve lies in the application of Bezier formula:

The P0-Pn in this formula represent various power operations from the starting point to each control point to the end point and the proportion t.
BezierMaker.prototype.bezier = function(t) { //贝塞尔公式调用
    var x = 0,
        y = 0,
        bezierCtrlNodesArr = this.bezierCtrlNodesArr,
        //控制点数组
        n = bezierCtrlNodesArr.length - 1,
        self = this
    bezierCtrlNodesArr.forEach(function(item, index) {
        if(!index) {
            x += item.x * Math.pow(( 1 - t ), n - index) * Math.pow(t, index)
            y += item.y * Math.pow(( 1 - t ), n - index) * Math.pow(t, index)
        } else {
        //factorial为阶乘函数
            x += self.factorial(n) / self.factorial(index) / self.factorial(n - index) * item.x * Math.pow(( 1 - t ), n - index) * Math.pow(t, index)
            y += self.factorial(n) / self.factorial(index) / self.factorial(n - index) * item.y * Math.pow(( 1 - t ), n - index) * Math.pow(t, index)
        }
    })
    return {
        x: x,
        y: y
    }
}Traverse all points and calculate the current point on the Bezier curve based on the value of the current proportion t (0<=t<=1) Coordinates x, y. The author divides the value of t into 1000 parts, that is, t+=0.01 for each operation. The x and y calculated at this time are the points after the Bezier curve is divided into 1000 parts. When the t value traverses from 0 to 1 1000 times, 1000 x and y corresponding coordinates are generated, and a high-order Bezier curve can be simulated by drawing points and lines in sequence.
The author will specifically explain the derivation of the Bezier formula in a later article. Now you only need to know that we use the Bezier formula to calculate the points at which the actual Bezier curve is divided into 1000 equal parts. , a class curve can be simulated by connecting each point with a straight line.
For the implementation of Bezier curve generation animation in the simulation field
This part of the relevant code can be referred to here
The overall idea is to use recursion to control each layer The points are treated as first-order Bessel functions to calculate the next layer of control points and corresponding connections. The author will leave the specific logic until the in-depth explanation of the Bezier curve formula principle and sort out the animation generation principle of the test site~
Related recommendations:
Use CSS to make Bezier CurveDetailed explanation of the application of Bezier curveCode demonstration for implementing canvas Bezier curve effectThe above is the detailed content of Canvas implements high-order Bezier curve. For more information, please follow other related articles on the PHP Chinese website!

Hot AI Tools

Undresser.AI Undress
AI-powered app for creating realistic nude photos

AI Clothes Remover
Online AI tool for removing clothes from photos.

Undress AI Tool
Undress images for free

Clothoff.io
AI clothes remover

Video Face Swap
Swap faces in any video effortlessly with our completely free AI face swap tool!

Hot Article
Hot Tools

Notepad++7.3.1
Easy-to-use and free code editor

SublimeText3 Chinese version
Chinese version, very easy to use

Zend Studio 13.0.1
Powerful PHP integrated development environment

Dreamweaver CS6
Visual web development tools

SublimeText3 Mac version
God-level code editing software (SublimeText3)
Hot Topics


 Which schools use canvas?
Aug 18, 2023 pm 05:59 PM
Which schools use canvas?
Aug 18, 2023 pm 05:59 PM
Schools using canvas include Stanford University, MIT, Columbia University, University of California, Berkeley, etc. Detailed introduction: 1. Stanford University uses Canvas as its main online learning platform. Teachers and students at Stanford University use Canvas to manage and communicate course content, and learn through functions such as online discussions, assignment submissions, and exams; 2. Ma Provincial Polytechnic Institute and MIT also use Canvas as their online learning management system and conduct course management through the Canvas platform; 3. Columbia University, etc.
 What are the canvas arrow plug-ins?
Aug 21, 2023 pm 02:14 PM
What are the canvas arrow plug-ins?
Aug 21, 2023 pm 02:14 PM
The canvas arrow plug-ins include: 1. Fabric.js, which has a simple and easy-to-use API and can create custom arrow effects; 2. Konva.js, which provides the function of drawing arrows and can create various arrow styles; 3. Pixi.js , which provides rich graphics processing functions and can achieve various arrow effects; 4. Two.js, which can easily create and control arrow styles and animations; 5. Arrow.js, which can create various arrow effects; 6. Rough .js, you can create hand-drawn arrows, etc.
 What are the details of the canvas clock?
Aug 21, 2023 pm 05:07 PM
What are the details of the canvas clock?
Aug 21, 2023 pm 05:07 PM
The details of the canvas clock include clock appearance, tick marks, digital clock, hour, minute and second hands, center point, animation effects, other styles, etc. Detailed introduction: 1. Clock appearance, you can use Canvas to draw a circular dial as the appearance of the clock, and you can set the size, color, border and other styles of the dial; 2. Scale lines, draw scale lines on the dial to represent hours or minutes. Position; 3. Digital clock, you can draw a digital clock on the dial to indicate the current hour and minute; 4. Hour hand, minute hand, second hand, etc.
 Learn the canvas framework and explain the commonly used canvas framework in detail
Jan 17, 2024 am 11:03 AM
Learn the canvas framework and explain the commonly used canvas framework in detail
Jan 17, 2024 am 11:03 AM
Explore the Canvas framework: To understand what are the commonly used Canvas frameworks, specific code examples are required. Introduction: Canvas is a drawing API provided in HTML5, through which we can achieve rich graphics and animation effects. In order to improve the efficiency and convenience of drawing, many developers have developed different Canvas frameworks. This article will introduce some commonly used Canvas frameworks and provide specific code examples to help readers gain a deeper understanding of how to use these frameworks. 1. EaselJS framework Ea
 uniapp implements how to use canvas to draw charts and animation effects
Oct 18, 2023 am 10:42 AM
uniapp implements how to use canvas to draw charts and animation effects
Oct 18, 2023 am 10:42 AM
How to use canvas to draw charts and animation effects in uniapp requires specific code examples 1. Introduction With the popularity of mobile devices, more and more applications need to display various charts and animation effects on the mobile terminal. As a cross-platform development framework based on Vue.js, uniapp provides the ability to use canvas to draw charts and animation effects. This article will introduce how uniapp uses canvas to achieve chart and animation effects, and give specific code examples. 2. canvas
 What versions of html2canvas are there?
Aug 22, 2023 pm 05:58 PM
What versions of html2canvas are there?
Aug 22, 2023 pm 05:58 PM
The versions of html2canvas include html2canvas v0.x, html2canvas v1.x, etc. Detailed introduction: 1. html2canvas v0.x, which is an early version of html2canvas. The latest stable version is v0.5.0-alpha1. It is a mature version that has been widely used and verified in many projects; 2. html2canvas v1.x, this is a new version of html2canvas.
 What properties does tkinter canvas have?
Aug 21, 2023 pm 05:46 PM
What properties does tkinter canvas have?
Aug 21, 2023 pm 05:46 PM
The tkinter canvas attributes include bg, bd, relief, width, height, cursor, highlightbackground, highlightcolor, highlightthickness, insertbackground, insertwidth, selectbackground, selectforeground, xscrollcommand attributes, etc. Detailed introduction
 Where are the canvas mouse coordinates?
Aug 22, 2023 pm 03:08 PM
Where are the canvas mouse coordinates?
Aug 22, 2023 pm 03:08 PM
How to get mouse coordinates for canvas: 1. Create a JavaScript sample file; 2. Get a reference to the Canvas element and add a listener for mouse movement events; 3. When the mouse moves on the Canvas, the getMousePos function will be triggered; 4. Use The "getBoundingClientRect()" method obtains the position and size information of the Canvas element, and obtains the mouse coordinates through event.clientX and event.clientY.
