

Detailed explanation of python3+PyQt5 custom view

This article mainly introduces the relevant information of python3 PyQt5 custom views in detail. It has certain reference value. Interested friends can refer to the several view classes provided by
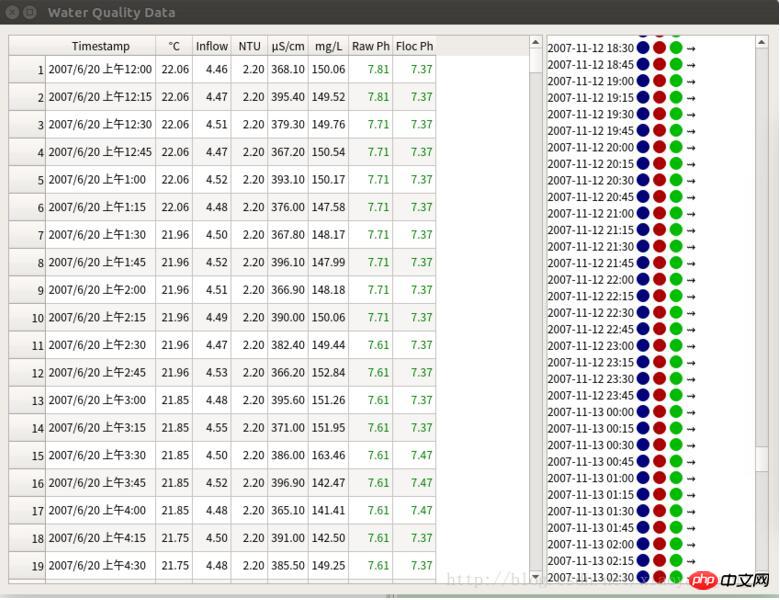
pyqt. Can work better, including QLisView, QTableView and QTreeView. But for some data that are difficult to present in existing ways, we can create our own view subclass and use it for visualization of model data to solve this problem. This article implements 16 chapters of python Qt GUI rapid programming examples through Python3 pyqt5.
#!/usr/bin/env python3

import gzip
import os
import platform
import sys
from PyQt5.QtCore import (QAbstractTableModel, QDateTime, QModelIndex,
    QSize, QTimer, QVariant, Qt,pyqtSignal)
from PyQt5.QtGui import ( QColor, QCursor, QFont,
    QFontDatabase, QFontMetrics, QPainter, QPalette, QPixmap)
from PyQt5.QtWidgets import QApplication,QDialog,QHBoxLayout, QLabel, QMessageBox,QScrollArea, QSplitter, QTableView,QWidget


(TIMESTAMP, TEMPERATURE, INLETFLOW, TURBIDITY, CONDUCTIVITY,
 COAGULATION, RAWPH, FLOCCULATEDPH) = range(8)

TIMESTAMPFORMAT = "yyyy-MM-dd hh:mm"


class WaterQualityModel(QAbstractTableModel):

  def __init__(self, filename):
    super(WaterQualityModel, self).__init__()
    self.filename = filename
    self.results = []


  def load(self):
    self.beginResetModel()
    exception = None
    fh = None
    try:
      if not self.filename:
        raise IOError("no filename specified for loading")
      self.results = []
      line_data = gzip.open(self.filename).read()
      for line in line_data.decode("utf8").splitlines():
        parts = line.rstrip().split(",")
        date = QDateTime.fromString(parts[0] + ":00",
                      Qt.ISODate)

        result = [date]
        for part in parts[1:]:
          result.append(float(part))
        self.results.append(result)

    except (IOError, ValueError) as e:
      exception = e
    finally:
      if fh is not None:
        fh.close()
      self.endResetModel()
      if exception is not None:
        raise exception


  def data(self, index, role=Qt.DisplayRole):
    if (not index.isValid() or
      not (0 <= index.row() < len(self.results))):
      return QVariant()
    column = index.column()
    result = self.results[index.row()]
    if role == Qt.DisplayRole:
      item = result[column]
      if column == TIMESTAMP:
        #item = item.toString(TIMESTAMPFORMAT)
        item=item
      else:
        #item = QString("%1").arg(item, 0, "f", 2)
        item = "{0:.2f}".format(item)
      return item
    elif role == Qt.TextAlignmentRole:
      if column != TIMESTAMP:
        return QVariant(int(Qt.AlignRight|Qt.AlignVCenter))
      return QVariant(int(Qt.AlignLeft|Qt.AlignVCenter))
    elif role == Qt.TextColorRole and column == INLETFLOW:
      if result[column] < 0:
        return QVariant(QColor(Qt.red))
    elif (role == Qt.TextColorRole and
       column in (RAWPH, FLOCCULATEDPH)):
      ph = result[column]
      if ph < 7:
        return QVariant(QColor(Qt.red))
      elif ph >= 8:
        return QVariant(QColor(Qt.blue))
      else:
        return QVariant(QColor(Qt.darkGreen))
    return QVariant()


  def headerData(self, section, orientation, role=Qt.DisplayRole):
    if role == Qt.TextAlignmentRole:
      if orientation == Qt.Horizontal:
        return QVariant(int(Qt.AlignCenter))
      return QVariant(int(Qt.AlignRight|Qt.AlignVCenter))
    if role != Qt.DisplayRole:
      return QVariant()
    if orientation == Qt.Horizontal:
      if section == TIMESTAMP:
        return "Timestamp"
      elif section == TEMPERATURE:
        return "\u00B0" +"C"
      elif section == INLETFLOW:
        return "Inflow"
      elif section == TURBIDITY:
        return "NTU"
      elif section == CONDUCTIVITY:
        return "\u03BCS/cm"
      elif section == COAGULATION:
        return "mg/L"
      elif section == RAWPH:
        return "Raw Ph"
      elif section == FLOCCULATEDPH:
        return "Floc Ph"
    return int(section + 1)


  def rowCount(self, index=QModelIndex()):
    return len(self.results)


  def columnCount(self, index=QModelIndex()):
    return 8


class WaterQualityView(QWidget):
  clicked = pyqtSignal(QModelIndex)
  FLOWCHARS = (chr(0x21DC), chr(0x21DD), chr(0x21C9))

  def __init__(self, parent=None):
    super(WaterQualityView, self).__init__(parent)
    self.scrollarea = None
    self.model = None
    self.setFocusPolicy(Qt.StrongFocus)
    self.selectedRow = -1
    self.flowfont = self.font()
    size = self.font().pointSize()
    if platform.system() == "Windows":
      fontDb = QFontDatabase()
      for face in [face.toLower() for face in fontDb.families()]:
        if face.contains("unicode"):
          self.flowfont = QFont(face, size)
          break
      else:
        self.flowfont = QFont("symbol", size)
        WaterQualityView.FLOWCHARS = (chr(0xAC), chr(0xAE),
                       chr(0xDE))


  def setModel(self, model):
    self.model = model
    #self.connect(self.model,
    #    SIGNAL("dataChanged(QModelIndex,QModelIndex)"),
    #    self.setNewSize)
    self.model.dataChanged.connect(self.setNewSize)
    #self.connect(self.model, SIGNAL("modelReset()"), self.setNewSize)
    self.model.modelReset.connect(self.setNewSize)
    self.setNewSize()


  def setNewSize(self):
    self.resize(self.sizeHint())
    self.update()
    self.updateGeometry()


  def minimumSizeHint(self):
    size = self.sizeHint()
    fm = QFontMetrics(self.font())
    size.setHeight(fm.height() * 3)
    return size


  def sizeHint(self):
    fm = QFontMetrics(self.font())
    size = fm.height()
    return QSize(fm.width("9999-99-99 99:99 ") + (size * 4),
           (size / 4) + (size * self.model.rowCount()))


  def paintEvent(self, event):
    if self.model is None:
      return
    fm = QFontMetrics(self.font())
    timestampWidth = fm.width("9999-99-99 99:99 ")
    size = fm.height()
    indicatorSize = int(size * 0.8)
    offset = int(1.5 * (size - indicatorSize))
    minY = event.rect().y()
    maxY = minY + event.rect().height() + size
    minY -= size
    painter = QPainter(self)
    painter.setRenderHint(QPainter.Antialiasing)
    painter.setRenderHint(QPainter.TextAntialiasing)
    y = 0
    for row in range(self.model.rowCount()):
      x = 0
      if minY <= y <= maxY:
        painter.save()
        painter.setPen(self.palette().color(QPalette.Text))
        if row == self.selectedRow:
          painter.fillRect(x, y + (offset * 0.8),
              self.width(), size, self.palette().highlight())
          painter.setPen(self.palette().color(
              QPalette.HighlightedText))
        #timestamp = self.model.data(
            #self.model.index(row, TIMESTAMP)).toDateTime()
        timestamp = self.model.data(self.model.index(row, TIMESTAMP))
        painter.drawText(x, y + size,
            timestamp.toString(TIMESTAMPFORMAT))
        #print(timestamp.toString(TIMESTAMPFORMAT))
        x += timestampWidth
        temperature = self.model.data(
            self.model.index(row, TEMPERATURE))
        #temperature = temperature.toDouble()[0]
        temperature = float(temperature)
        if temperature < 20:
          color = QColor(0, 0,
              int(255 * (20 - temperature) / 20))
        elif temperature > 25:
          color = QColor(int(255 * temperature / 100), 0, 0)
        else:
          color = QColor(0, int(255 * temperature / 100), 0)
        painter.setPen(Qt.NoPen)
        painter.setBrush(color)
        painter.drawEllipse(x, y + offset, indicatorSize,
                  indicatorSize)
        x += size
        rawPh = self.model.data(self.model.index(row, RAWPH))
        #rawPh = rawPh.toDouble()[0]
        rawPh = float(rawPh)
        if rawPh < 7:
          color = QColor(int(255 * rawPh / 10), 0, 0)
        elif rawPh >= 8:
          color = QColor(0, 0, int(255 * rawPh / 10))
        else:
          color = QColor(0, int(255 * rawPh / 10), 0)
        painter.setBrush(color)
        painter.drawEllipse(x, y + offset, indicatorSize,
                  indicatorSize)
        x += size
        flocPh = self.model.data(
            self.model.index(row, FLOCCULATEDPH))
        #flocPh = flocPh.toDouble()[0]
        flocPh = float(flocPh)
        if flocPh < 7:
          color = QColor(int(255 * flocPh / 10), 0, 0)
        elif flocPh >= 8:
          color = QColor(0, 0, int(255 * flocPh / 10))
        else:
          color = QColor(0, int(255 * flocPh / 10), 0)
        painter.setBrush(color)
        painter.drawEllipse(x, y + offset, indicatorSize,
                  indicatorSize)
        painter.restore()
        painter.save()
        x += size
        flow = self.model.data(
            self.model.index(row, INLETFLOW))
        #flow = flow.toDouble()[0]
        flow = float(flow)
        char = None
        if flow <= 0:
          char = WaterQualityView.FLOWCHARS[0]
        elif flow < 3.6:
          char = WaterQualityView.FLOWCHARS[1]
        elif flow > 4.7:
          char = WaterQualityView.FLOWCHARS[2]
        if char is not None:
          painter.setFont(self.flowfont)
          painter.drawText(x, y + size, char)
        painter.restore()
      y += size
      if y > maxY:
        break


  def mousePressEvent(self, event):
    fm = QFontMetrics(self.font())
    self.selectedRow = event.y() // fm.height()
    self.update()
    #self.emit(SIGNAL("clicked(QModelIndex)"),
    #     self.model.index(self.selectedRow, 0))
    self.clicked.emit(self.model.index(self.selectedRow, 0))


  def keyPressEvent(self, event):
    if self.model is None:
      return
    row = -1
    if event.key() == Qt.Key_Up:
      row = max(0, self.selectedRow - 1)
    elif event.key() == Qt.Key_Down:
      row = min(self.selectedRow + 1, self.model.rowCount() - 1)
    if row != -1 and row != self.selectedRow:
      self.selectedRow = row
      if self.scrollarea is not None:
        fm = QFontMetrics(self.font())
        y = fm.height() * self.selectedRow
        print(y)
        self.scrollarea.ensureVisible(0, y)
      self.update()
      #self.emit(SIGNAL("clicked(QModelIndex)"),
      #     self.model.index(self.selectedRow, 0))
      self.clicked.emit(self.model.index(self.selectedRow, 0))
    else:
      QWidget.keyPressEvent(self, event)


class MainForm(QDialog):

  def __init__(self, parent=None):
    super(MainForm, self).__init__(parent)

    self.model = WaterQualityModel(os.path.join(
        os.path.dirname(__file__), "waterdata.csv.gz"))
    self.tableView = QTableView()
    self.tableView.setAlternatingRowColors(True)
    self.tableView.setModel(self.model)
    self.waterView = WaterQualityView()
    self.waterView.setModel(self.model)
    scrollArea = QScrollArea()
    scrollArea.setBackgroundRole(QPalette.Light)
    scrollArea.setWidget(self.waterView)
    self.waterView.scrollarea = scrollArea

    splitter = QSplitter(Qt.Horizontal)
    splitter.addWidget(self.tableView)
    splitter.addWidget(scrollArea)
    splitter.setSizes([600, 250])
    layout = QHBoxLayout()
    layout.addWidget(splitter)
    self.setLayout(layout)

    self.setWindowTitle("Water Quality Data")
    QTimer.singleShot(0, self.initialLoad)


  def initialLoad(self):
    QApplication.setOverrideCursor(QCursor(Qt.WaitCursor))
    splash = QLabel(self)
    pixmap = QPixmap(os.path.join(os.path.dirname(__file__),
        "iss013-e-14802.jpg"))
    #print(os.path.join(os.path.dirname(__file__),
    #    "iss013-e-14802.jpg"))
    splash.setPixmap(pixmap)
    splash.setWindowFlags(Qt.SplashScreen)
    splash.move(self.x() + ((self.width() - pixmap.width()) / 2),
          self.y() + ((self.height() - pixmap.height()) / 2))
    splash.show()
    QApplication.processEvents()
    try:
      self.model.load()
    except IOError as e:
      QMessageBox.warning(self, "Water Quality - Error", e)
    else:
      self.tableView.resizeColumnsToContents()
    splash.close()
    QApplication.processEvents()
    QApplication.restoreOverrideCursor()


app = QApplication(sys.argv)
form = MainForm()
form.resize(850, 620)
form.show()
app.exec_()Run results:
python3 PyQt5 implements histogram
python3 PyQt5 implements document printing function
python3 PyQt5 implements page indexer application that supports multi-threading
The above is the detailed content of Detailed explanation of python3+PyQt5 custom view. For more information, please follow other related articles on the PHP Chinese website!

Hot AI Tools

Undresser.AI Undress
AI-powered app for creating realistic nude photos

AI Clothes Remover
Online AI tool for removing clothes from photos.

Undress AI Tool
Undress images for free

Clothoff.io
AI clothes remover

Video Face Swap
Swap faces in any video effortlessly with our completely free AI face swap tool!

Hot Article
Hot Tools

Notepad++7.3.1
Easy-to-use and free code editor

SublimeText3 Chinese version
Chinese version, very easy to use

Zend Studio 13.0.1
Powerful PHP integrated development environment

Dreamweaver CS6
Visual web development tools

SublimeText3 Mac version
God-level code editing software (SublimeText3)
Hot Topics


 How to quickly set up a custom avatar in Netflix
Feb 19, 2024 pm 06:33 PM
How to quickly set up a custom avatar in Netflix
Feb 19, 2024 pm 06:33 PM
An avatar on Netflix is a visual representation of your streaming identity. Users can go beyond the default avatar to express their personality. Continue reading this article to learn how to set a custom profile picture in the Netflix app. How to quickly set a custom avatar in Netflix In Netflix, there is no built-in feature to set a profile picture. However, you can do this by installing the Netflix extension on your browser. First, install a custom profile picture for the Netflix extension on your browser. You can buy it in the Chrome store. After installing the extension, open Netflix on your browser and log into your account. Navigate to your profile in the upper right corner and click
 Detailed explanation of obtaining administrator rights in Win11
Mar 08, 2024 pm 03:06 PM
Detailed explanation of obtaining administrator rights in Win11
Mar 08, 2024 pm 03:06 PM
Windows operating system is one of the most popular operating systems in the world, and its new version Win11 has attracted much attention. In the Win11 system, obtaining administrator rights is an important operation. Administrator rights allow users to perform more operations and settings on the system. This article will introduce in detail how to obtain administrator permissions in Win11 system and how to effectively manage permissions. In the Win11 system, administrator rights are divided into two types: local administrator and domain administrator. A local administrator has full administrative rights to the local computer
 How to customize shortcut key settings in Eclipse
Jan 28, 2024 am 10:01 AM
How to customize shortcut key settings in Eclipse
Jan 28, 2024 am 10:01 AM
How to customize shortcut key settings in Eclipse? As a developer, mastering shortcut keys is one of the keys to improving efficiency when coding in Eclipse. As a powerful integrated development environment, Eclipse not only provides many default shortcut keys, but also allows users to customize them according to their own preferences. This article will introduce how to customize shortcut key settings in Eclipse and give specific code examples. Open Eclipse First, open Eclipse and enter
 Detailed explanation of division operation in Oracle SQL
Mar 10, 2024 am 09:51 AM
Detailed explanation of division operation in Oracle SQL
Mar 10, 2024 am 09:51 AM
Detailed explanation of division operation in OracleSQL In OracleSQL, division operation is a common and important mathematical operation, used to calculate the result of dividing two numbers. Division is often used in database queries, so understanding the division operation and its usage in OracleSQL is one of the essential skills for database developers. This article will discuss the relevant knowledge of division operations in OracleSQL in detail and provide specific code examples for readers' reference. 1. Division operation in OracleSQL
 The operation process of edius custom screen layout
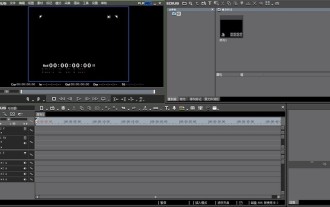
Mar 27, 2024 pm 06:50 PM
The operation process of edius custom screen layout
Mar 27, 2024 pm 06:50 PM
1. The picture below is the default screen layout of edius. The default EDIUS window layout is a horizontal layout. Therefore, in a single-monitor environment, many windows overlap and the preview window is in single-window mode. 2. You can enable [Dual Window Mode] through the [View] menu bar to make the preview window display the playback window and recording window at the same time. 3. You can restore the default screen layout through [View menu bar>Window Layout>General]. In addition, you can also customize the layout that suits you and save it as a commonly used screen layout: drag the window to a layout that suits you, then click [View > Window Layout > Save Current Layout > New], and in the pop-up [Save Current Layout] Layout] enter the layout name in the small window and click OK
 Detailed explanation of the role and usage of PHP modulo operator
Mar 19, 2024 pm 04:33 PM
Detailed explanation of the role and usage of PHP modulo operator
Mar 19, 2024 pm 04:33 PM
The modulo operator (%) in PHP is used to obtain the remainder of the division of two numbers. In this article, we will discuss the role and usage of the modulo operator in detail, and provide specific code examples to help readers better understand. 1. The role of the modulo operator In mathematics, when we divide an integer by another integer, we get a quotient and a remainder. For example, when we divide 10 by 3, the quotient is 3 and the remainder is 1. The modulo operator is used to obtain this remainder. 2. Usage of the modulo operator In PHP, use the % symbol to represent the modulus
 Detailed explanation of the linux system call system() function
Feb 22, 2024 pm 08:21 PM
Detailed explanation of the linux system call system() function
Feb 22, 2024 pm 08:21 PM
Detailed explanation of Linux system call system() function System call is a very important part of the Linux operating system. It provides a way to interact with the system kernel. Among them, the system() function is one of the commonly used system call functions. This article will introduce the use of the system() function in detail and provide corresponding code examples. Basic Concepts of System Calls System calls are a way for user programs to interact with the operating system kernel. User programs request the operating system by calling system call functions
 How to customize x-axis and y-axis in excel? (How to customize excel axis scale)
Mar 14, 2024 pm 02:10 PM
How to customize x-axis and y-axis in excel? (How to customize excel axis scale)
Mar 14, 2024 pm 02:10 PM
In an excel table, sometimes you may need to insert coordinate axes to see the changing trend of the data more intuitively. Some friends still don’t know how to insert coordinate axes in the table. Next, I will share with you how to customize the coordinate axis scale in Excel. Coordinate axis insertion method: 1. In the excel interface, select the data. 2. In the insertion interface, click to insert a column chart or bar chart. 3. In the expanded interface, select the graphic type. 4. In the right-click interface of the table, click Select Data. 5. In the expanded interface, you can customize it.
