

Detailed explanation of JS debugging usage
This time I will bring you a detailed explanation of the use of JS debugging, what are the precautions for JS debugging, the following is a practical case, let's take a look.
Just imagine: a certain bug occurs, someone fixes it in a few minutes, and someone spends half a day or a day still unable to find the cause. Would you rather be the former or the latter? If you think you are the former, please read this article carefully. Please note that the article involves many Gif demonstration animations.
Preface: Any programmer must debug the code. Whether you are an expert or a novice, debugging a program is an essential task. Generally speaking, debugging is done after the code is written or when bugs are corrected during the testing period. It is often during the debugging period that it can better reflect the level of the programmer and the accuracy of analyzing the problem. Many beginners always miss the point when looking for the cause of errors, spending a lot of time but unable to solve some bugs that turn out to be quite simple. Mastering various debugging skills will definitely help you get twice the result with half the effort at work. For example, it can quickly locate problems, reduce failure probability, help analyze logic errors, etc. Today, when Internet front-end development is becoming more and more important, how to reduce development costs and improve work efficiency in front-end development and master front-end development and debugging skills is particularly important.
This article will explain various front-end JS debugging skills one by one. Maybe you are already proficient in it, so let us review it together. Maybe there are methods you have never seen before, so you might as well learn them together. Maybe you don’t know how yet? Debugging, hurry up and take this opportunity to fill in the gaps.
1. Alert, a hard-core debugging master
It was still the era when the Internet was just starting. The front-end of web pages was mainly focused on content display, and browser scripts could only When the page provides very simple accessibility functions. At that time, web pages were mainly run in browsers based on IE6, and the debugging function of JS was still very weak. It could only be debugged through the alert method built into the Window object. At that time, it seemed like It looks like this:

It needs to be explained that the effect seen here is not the effect seen in the IE browser of the year, but the effect in the higher version of IE. In addition, it seems that there was no such advanced console back then, and the use of alert was also in the real page JS code. Although the debugging method of alert is very primitive, it did have its indelible value at the time, and even today, it has its place.
2. The new generation of debugging king Console
As JS can do more and more things in the Web front-end, its responsibilities are getting bigger and its status is also increasing. more and more important. The traditional alert debugging method has gradually been unable to meet the various scenarios of front-end development. Moreover, the debugging information that pops up in the alert debugging mode is not very beautiful, and it blocks part of the page content, which is really not very friendly.
On the other hand, for alert debugging information, statements like "alert(xxxxx)" must be added to the program logic to work properly, and alert will prevent the page from continuing to render. This means that after developers complete debugging, they must manually clear these debugging codes, which is really troublesome.
Therefore, the new generation of browsers Firefox, Chrome, including IE, have successively launched JS debugging consoles, supporting the use of a form similar to "console.log(xxxx)" to print debugging information on the console. It does not directly affect page display. Taking IE as an example, it looks like this:
Okay, goodbye ugly alert popup. And the rising stars, led by the Chrome browser, have expanded the Console with richer functions:
Do you think this is enough? The imagination of the Chrome development team really has to be admired:

Okay, let’s go off topic a little bit more. In short, the emergence of the console and the browser's built-in Console object has brought great convenience to front-end development and debugging.
Some people may ask, does such debugging code need to be cleaned after debugging is completed?
Regarding this issue, if you verify the existence of the console object before using it, it will not cause damage to the business logic without deleting it. Of course, for the sake of clean code, after debugging is completed, these debugging codes that have nothing to do with business logic should be deleted as much as possible.
3. JS breakpoint debugging
Breakpoint, one of the functions of the debugger, can interrupt the program where needed, thereby facilitating its analysis. You can also set a breakpoint during one debugging. Next time, you only need to let the program automatically run to the set breakpoint position, and then it can be interrupted at the last set breakpoint position, which greatly facilitates operation and saves time. ——Baidu Encyclopedia
JS breakpoint debugging is to add breakpoints to the JS code in the browser developer tools to let the JS execution stop at a specific location to facilitate developers to debug the code segment. analysis and logical processing. In order to be able to observe the effect of breakpoint debugging, we prepare a piece of JS code in advance:
The code is very simple, just define a function and pass it in After adding a random random integer to two numbers, the sum of the two numbers is returned. Taking Chrome developer tools as an example, let's take a look at the basic method of JS breakpoint debugging.
3.1. Sources breakpoint
First of all, in the test code, we can see from the console output in the figure above that the code should be running normally, but why should it be Woolen cloth? Because a random number is added to the function, is the final result really correct? This is a meaningless conjecture, but suppose I want to verify it now: the two numbers passed in by the function, the random numbers added, and the final sum. So how to do it?
Method 1, the most common one mentioned before, whether using alert or console, we can verify it like this:
From the above figure, we find that Three lines of console code have been added to the code to print the data variables we care about. In the end, the output results from the console (Console panel) can clearly verify whether the entire calculation process is normal, and thus achieve our problem. verification requirements.
Method 2. The verification process of Method 1 has an obvious drawback, which is that it adds a lot of redundant code. Next, let’s see if it is more convenient to use breakpoints for verification. Let’s first look at how to add breakpoints. , and the effect after the breakpoint:

As shown in the figure, the process of adding a breakpoint to a piece of code is "F12 (Ctrl Shift I) to open the development tool"——" Click the Sources menu" - "Find the corresponding file in the tree on the left" - "Click the line number column" to complete the operation of adding/deleting breakpoints on the current line. After the breakpoint is added, refresh the page and JS execution stops at the breakpoint position. You will see all the variables and values in the current scope on the Sources interface. You only need to verify each value to complete the verification requirements of our question.
Here comes the problem. Careful friends will find that when my code is executed to the breakpoint, the displayed values of variables a and b have been added, and we cannot see the call to sum. The function is initially passed in 10 and 20. Then what should be done? It’s time to go back and learn some basic knowledge of breakpoint debugging. After we open the Sources panel, we will actually see the following content in the interface. Let’s follow the mouse trajectory to see what it means one by one:

From left to right, each icon represents The functions are:
Pause/Resume script execution: Pause/resume script execution (program execution stops at the next breakpoint).
Step over next function call: Execute the function call to the next step (jump to the next line).
Step into next function call: Enter the current function.
Step out of current function: Jump out of the current execution function.
Deactive/Active all breakpoints: Close/enable all breakpoints (will not cancel).
Pause on exceptions: Automatic breakpoint setting for exceptions.
At this point, the function keys of breakpoint debugging are almost introduced. Next, we can look at our program code line by line and check the changes of each of our variables after each line is executed, as shown in the figure below. :

As above, we can see the entire process of variables a and b from the initial value, to adding random values in the middle, to finally calculating the sum and outputting the final result. Completing the question design verification requirements is a piece of cake.
For the remaining function keys, we slightly change our test code and use a gif picture to demonstrate their use:
Needed here Note that the function of printing variable values directly in the code area is a new function only added to newer versions of Chrome browsers. If you are still using an older version of Chrome browsers, you may not be able to directly print variable values in the case of breakpoints. To view variable information, you can move the mouse over the variable name and pause briefly, and the variable value will appear. You can also use the mouse to select the variable name, then right-click "Add to watch" to view it in the Watch panel. This method also applies to expressions. In addition, you can also switch to the Console panel under a breakpoint, directly enter the name of the variable in the console , and press Enter to view the variable information. This part is relatively simple. Considering the space issue, no diagram demonstration will be given.
3.2. Debugger breakpoint
The so-called Debugger breakpoint is actually named by me myself. I don’t know how to use the professional terminology. Specifically, by adding a "debugger;" statement to the code, a breakpoint will be automatically reached when the code is executed. The next operation is almost exactly the same as adding breakpoint debugging in the Sources panel. The only difference is that you need to delete the statement after debugging.
Since the function is the same as adding breakpoints in the Sources panel except for the different ways of setting breakpoints, why does this method still exist? I think the reason is this: During development, we occasionally encounter asynchronous loading of html fragments (including embedded JS code), and this part of the JS code cannot be found in the Sources tree, so it cannot be added directly in the development tools. Breakpoint, then if you want to add a breakpoint to an asynchronously loaded script, then "debugger;" comes into play. Let’s see its effect directly through the gif:
4. DOM breakpoint debugging
DOM breakpoint, as the name suggests Add breakpoints on DOM elements for debugging purposes. In the actual use of break points, the effect is ultimately implemented within JS logic. Let’s take a look at the specific effects of each DOM breakpoint in turn.
4.1. Break on subtree modifications when the internal sub-nodes of the node change
As front-end development becomes more and more complex, front-end JS code becomes more and more complex. The more there are, the more complex the logic becomes. A seemingly simple Web page is usually accompanied by large sections of JS code, involving many operations of adding, deleting, and modifying DOM nodes. It is inevitable to encounter situations where it is difficult to locate the code segment directly through the JS code, but we can quickly locate the relevant DOM nodes through the Elements panel of the developer tools. At this time, locating the script through DOM breakpoints is particularly important. Specifically, let’s take a look at the gif demonstration:

The above figure demonstrates the effect of adding, deleting and exchanging sequence operations of ul sub-nodes (li) to trigger breakpoints . However, it should be noted that modifying attributes and content of child nodes will not trigger breakpoints.
4.2. Break on attributes modifications when node attributes change
On the other hand, as the business logic of front-end processing becomes more and more complex, the The storage dependence of some data is getting stronger and stronger, and storing temporary data in the (custom) attributes of DOM nodes is the preferred method for developers in many cases. Especially after the HTML5 standard enhanced custom attribute support (for example: dataset, data-*, etc.), attribute settings are used more and more, so Chrome developer tools also provide attribute change breakpoint support, the effect is roughly as follows:
This method also needs to be noted that any operation on the properties of the child node will not trigger the breakpoint of the node itself.
4.3. Break on node removal
This DOM breakpoint setting is very simple and the triggering method is very clear - when the node when deleted. So usually this method should be used when executing the "parentNode.removeChild(childNode)" statement. This method is not used much.
The previously introduced debugging methods are basically the debugging methods we often use in daily development. If used properly, they can deal with almost all problems in our daily development. However, the developer tools also take into account more situations and provide more breakpoint methods, as shown in the figure:
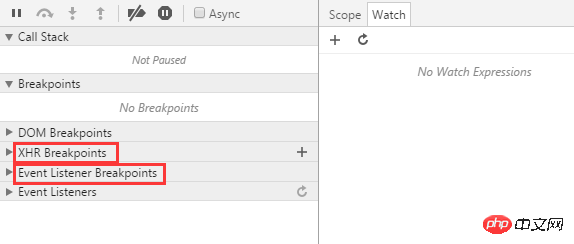
5, XHR Breakpoints
Front-end development has undergone earth-shaking changes in the past few years. From being unknown at the beginning to being very popular today, Ajax-driven Web rich applications and mobile WebApp single-page applications have become popular. All of this is inseparable from the XMLHttpRequest object, and "XHR Breakpoints" is a breakpoint debugging function designed for asynchronous use.

We can add breakpoint conditions for asynchronous breakpoints through the " " number on the right side of "XHR Breakpoints". When the asynchronous request is triggered, the URL meets this condition, JS logic A breakpoint will be automatically generated. The breakpoint location is not shown in the demo animation. This is because the demo uses the ajax method encapsulated by jQuery. The code has been compressed and there is no visible effect. In fact, the location where the XHR breakpoint is generated is "xhr. send()" statement.
The power of XHR breakpoints is that you can customize breakpoint rules, which means that we can set breakpoints for a certain batch, a certain one, or even all asynchronous requests, which is very powerful. However, it seems that this feature is not used much in daily development, at least not by me. Thinking about it, there are probably two reasons: first, this type of breakpoint debugging requirement is not involved much in daily business; second, most front-end development at this stage is based on JS framework, and the most basic jQuery has also implemented Ajax. In order to ensure good encapsulation, few people encapsulate Ajax methods themselves. In order to reduce the code size, projects usually choose compressed code libraries, making XHR breakpoint tracking relatively difficult.
6. Event Listener Breakpoints
Event listener breakpoints are set according to the event name. When an event is triggered, the breakpoint is set to the location where the event is bound. Event listener breakpoints list all page and script events, including: mouse, keyboard, animation, timer, XHR, etc. It greatly reduces the difficulty of debugging event-related business logic.

DemonstrationExample demonstration shows the breakpoint effect when the click event is triggered and when setTimeout is set. The example shows that when the click event breakpoint is selected, the breakpoints are triggered when both buttons are clicked, and when setTimeout is set, the "Set Timer" breakpoint is triggered.
Debugging is a very important link in project development. It can not only help us quickly locate problems, but also save our development time. Being proficient in various debugging methods will definitely bring many benefits to your career development. However, among so many debugging methods, how to choose one that suits your current application scenario requires experience and continuous trial and error accumulation.
I believe you have mastered the method after reading the case in this article. For more exciting information, please pay attention to other related articles on the php Chinese website!
Recommended reading:
js implements front-end and backend transmission of Json
JS sends json format POST request implementation steps
How to use the Post method to pass json parameters
The above is the detailed content of Detailed explanation of JS debugging usage. For more information, please follow other related articles on the PHP Chinese website!

Hot AI Tools

Undresser.AI Undress
AI-powered app for creating realistic nude photos

AI Clothes Remover
Online AI tool for removing clothes from photos.

Undress AI Tool
Undress images for free

Clothoff.io
AI clothes remover

Video Face Swap
Swap faces in any video effortlessly with our completely free AI face swap tool!

Hot Article
Hot Tools

Notepad++7.3.1
Easy-to-use and free code editor

SublimeText3 Chinese version
Chinese version, very easy to use

Zend Studio 13.0.1
Powerful PHP integrated development environment

Dreamweaver CS6
Visual web development tools

SublimeText3 Mac version
God-level code editing software (SublimeText3)
Hot Topics


 What software is crystaldiskmark? -How to use crystaldiskmark?
Mar 18, 2024 pm 02:58 PM
What software is crystaldiskmark? -How to use crystaldiskmark?
Mar 18, 2024 pm 02:58 PM
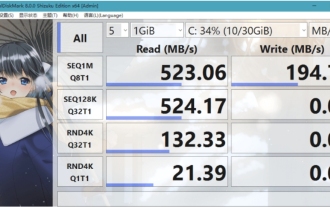
CrystalDiskMark is a small HDD benchmark tool for hard drives that quickly measures sequential and random read/write speeds. Next, let the editor introduce CrystalDiskMark to you and how to use crystaldiskmark~ 1. Introduction to CrystalDiskMark CrystalDiskMark is a widely used disk performance testing tool used to evaluate the read and write speed and performance of mechanical hard drives and solid-state drives (SSD). Random I/O performance. It is a free Windows application and provides a user-friendly interface and various test modes to evaluate different aspects of hard drive performance and is widely used in hardware reviews
 How to download foobar2000? -How to use foobar2000
Mar 18, 2024 am 10:58 AM
How to download foobar2000? -How to use foobar2000
Mar 18, 2024 am 10:58 AM
foobar2000 is a software that can listen to music resources at any time. It brings you all kinds of music with lossless sound quality. The enhanced version of the music player allows you to get a more comprehensive and comfortable music experience. Its design concept is to play the advanced audio on the computer The device is transplanted to mobile phones to provide a more convenient and efficient music playback experience. The interface design is simple, clear and easy to use. It adopts a minimalist design style without too many decorations and cumbersome operations to get started quickly. It also supports a variety of skins and Theme, personalize settings according to your own preferences, and create an exclusive music player that supports the playback of multiple audio formats. It also supports the audio gain function to adjust the volume according to your own hearing conditions to avoid hearing damage caused by excessive volume. Next, let me help you
 How to use NetEase Mailbox Master
Mar 27, 2024 pm 05:32 PM
How to use NetEase Mailbox Master
Mar 27, 2024 pm 05:32 PM
NetEase Mailbox, as an email address widely used by Chinese netizens, has always won the trust of users with its stable and efficient services. NetEase Mailbox Master is an email software specially created for mobile phone users. It greatly simplifies the process of sending and receiving emails and makes our email processing more convenient. So how to use NetEase Mailbox Master, and what specific functions it has. Below, the editor of this site will give you a detailed introduction, hoping to help you! First, you can search and download the NetEase Mailbox Master app in the mobile app store. Search for "NetEase Mailbox Master" in App Store or Baidu Mobile Assistant, and then follow the prompts to install it. After the download and installation is completed, we open the NetEase email account and log in. The login interface is as shown below
 How to use Baidu Netdisk app
Mar 27, 2024 pm 06:46 PM
How to use Baidu Netdisk app
Mar 27, 2024 pm 06:46 PM
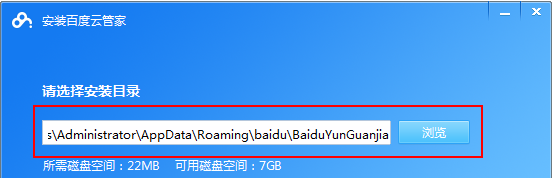
Cloud storage has become an indispensable part of our daily life and work nowadays. As one of the leading cloud storage services in China, Baidu Netdisk has won the favor of a large number of users with its powerful storage functions, efficient transmission speed and convenient operation experience. And whether you want to back up important files, share information, watch videos online, or listen to music, Baidu Cloud Disk can meet your needs. However, many users may not understand the specific use method of Baidu Netdisk app, so this tutorial will introduce in detail how to use Baidu Netdisk app. Users who are still confused can follow this article to learn more. ! How to use Baidu Cloud Network Disk: 1. Installation First, when downloading and installing Baidu Cloud software, please select the custom installation option.
 BTCC tutorial: How to bind and use MetaMask wallet on BTCC exchange?
Apr 26, 2024 am 09:40 AM
BTCC tutorial: How to bind and use MetaMask wallet on BTCC exchange?
Apr 26, 2024 am 09:40 AM
MetaMask (also called Little Fox Wallet in Chinese) is a free and well-received encryption wallet software. Currently, BTCC supports binding to the MetaMask wallet. After binding, you can use the MetaMask wallet to quickly log in, store value, buy coins, etc., and you can also get 20 USDT trial bonus for the first time binding. In the BTCCMetaMask wallet tutorial, we will introduce in detail how to register and use MetaMask, and how to bind and use the Little Fox wallet in BTCC. What is MetaMask wallet? With over 30 million users, MetaMask Little Fox Wallet is one of the most popular cryptocurrency wallets today. It is free to use and can be installed on the network as an extension
 Detailed explanation of obtaining administrator rights in Win11
Mar 08, 2024 pm 03:06 PM
Detailed explanation of obtaining administrator rights in Win11
Mar 08, 2024 pm 03:06 PM
Windows operating system is one of the most popular operating systems in the world, and its new version Win11 has attracted much attention. In the Win11 system, obtaining administrator rights is an important operation. Administrator rights allow users to perform more operations and settings on the system. This article will introduce in detail how to obtain administrator permissions in Win11 system and how to effectively manage permissions. In the Win11 system, administrator rights are divided into two types: local administrator and domain administrator. A local administrator has full administrative rights to the local computer
 Detailed explanation of division operation in Oracle SQL
Mar 10, 2024 am 09:51 AM
Detailed explanation of division operation in Oracle SQL
Mar 10, 2024 am 09:51 AM
Detailed explanation of division operation in OracleSQL In OracleSQL, division operation is a common and important mathematical operation, used to calculate the result of dividing two numbers. Division is often used in database queries, so understanding the division operation and its usage in OracleSQL is one of the essential skills for database developers. This article will discuss the relevant knowledge of division operations in OracleSQL in detail and provide specific code examples for readers' reference. 1. Division operation in OracleSQL
 Teach you how to use the new advanced features of iOS 17.4 'Stolen Device Protection'
Mar 10, 2024 pm 04:34 PM
Teach you how to use the new advanced features of iOS 17.4 'Stolen Device Protection'
Mar 10, 2024 pm 04:34 PM
Apple rolled out the iOS 17.4 update on Tuesday, bringing a slew of new features and fixes to iPhones. The update includes new emojis, and EU users will also be able to download them from other app stores. In addition, the update also strengthens the control of iPhone security and introduces more "Stolen Device Protection" setting options to provide users with more choices and protection. "iOS17.3 introduces the "Stolen Device Protection" function for the first time, adding extra security to users' sensitive information. When the user is away from home and other familiar places, this function requires the user to enter biometric information for the first time, and after one hour You must enter information again to access and change certain data, such as changing your Apple ID password or turning off stolen device protection.
