
 Web Front-end
JS Tutorial
Code to implement dynamic addition and statistics of table data based on jQuery_jquery
Web Front-end
JS Tutorial
Code to implement dynamic addition and statistics of table data based on jQuery_jquery
Code to implement dynamic addition and statistics of table data based on jQuery_jquery

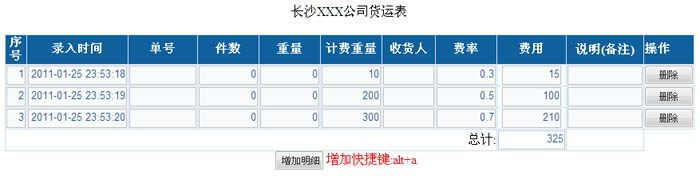
图(1.1)
某物流信息系统中的功能要求如图1.1所示,表格中每一行代表一笔运送货物的信息,在录入每行的计费重量和费率后,要求能按一定的公式,自动计算运送费用,并且能自动统计所有运送货物的总运费。运送货物信息的数据量(即表格的行数)不定,要求能动态增加、删除,即表格的数据行数是动态可维护的。同时为了方便操作,需要在页面中能像使用键盘的上下左右方向键,在录入的文本框之间进行切换。每行的数据有一定的校验要求,比如单号必须为8位数字,件数和重量必须为数字...
单行货物信息计算运费不难实现,只需要在计费重量和费率的文本框对象的onblur事件中,得到费率和计费重量,按照公式计算好运费即可。
总计费用的统计也不难实现,遍历整个表格的所有费用对象,统计其和,将计算结果放到总计的文本框对象即可。
难点在动态添加整行表格数据,而且每行数据上的各文本框对象的事件也要实现自动统计和运算,有相当的难度。如果使用JavaScript需要调用Dom对象创建一个 使用jQuery可以大大减轻工作量,在实际开发中,使用了jQuery的clone(true)函数,该函数可以创建一个jQury对象的副本,并且参数为true时,可以复制该元素的所有事件处理函数。 We can implement the calculation of shipping costs in the first line.然后点增加明细按钮时,调用jQuery 的clone(true)函数,建立第一行的副本对象插入到表格下方,由于使用clone(true)可以复制对象的事件处理函数,所以每行中文本框的onblur事件和运费计算函数也被成功复制,不需再做处理。大大减轻了工作量。 AI-powered app for creating realistic nude photos Online AI tool for removing clothes from photos. Undress images for free AI clothes remover Swap faces in any video effortlessly with our completely free AI face swap tool! Easy-to-use and free code editor Chinese version, very easy to use Powerful PHP integrated development environment Visual web development tools God-level code editing software (SublimeText3) How to implement data statistics and analysis in uniapp 1. Background introduction Data statistics and analysis are a very important part of the mobile application development process. Through statistics and analysis of user behavior, developers can have an in-depth understanding of user preferences and usage habits. Thereby optimizing product design and user experience. This article will introduce how to implement data statistics and analysis functions in uniapp, and provide some specific code examples. 2. Choose appropriate data statistics and analysis tools. The first step to implement data statistics and analysis in uniapp is to choose the appropriate data statistics and analysis tools. The linear and pie chart functions of Vue statistical charts are implemented in the field of data analysis and visualization. Statistical charts are a very commonly used tool. As a popular JavaScript framework, Vue provides convenient methods to implement various functions, including the display and interaction of statistical charts. This article will introduce how to use Vue to implement linear and pie chart functions, and provide corresponding code examples. Linear graph function implementation A linear graph is a type of chart used to display trends and changes in data. In Vue, we can use some excellent How to use SQL statements for data aggregation and statistics in MySQL? Data aggregation and statistics are very important steps when performing data analysis and statistics. As a powerful relational database management system, MySQL provides a wealth of aggregation and statistical functions, which can easily perform data aggregation and statistical operations. This article will introduce the method of using SQL statements to perform data aggregation and statistics in MySQL, and provide specific code examples. 1. Use the COUNT function for counting. The COUNT function is the most commonly used How to quickly build a statistical chart system under the Vue framework. In modern web applications, statistical charts are an essential component. As a popular front-end framework, Vue.js provides many convenient tools and components that can help us quickly build a statistical chart system. This article will introduce how to use the Vue framework and some plug-ins to build a simple statistical chart system. First, we need to prepare a Vue.js development environment, including installing Vue scaffolding and some related plug-ins. Execute the following command in the command line Statistical analysis often refers to the process of sorting, classifying and interpreting collected relevant data. The basic steps of statistical analysis include: 1. Collect data; 2. Organize data; 3. Analyze data. With the rapid development of the Internet, the use of Web applications is becoming more and more common. How to monitor and analyze the usage of Web applications has become a focus of developers and website operators. Google Analytics is a powerful website analytics tool that can track and analyze the behavior of website visitors. This article will introduce how to use Google Analytics in Beego to collect website data. 1. To register a Google Analytics account, you first need to How to use MySQL's COUNT function to count the number of rows in a data table. In MySQL, the COUNT function is a very powerful function that is used to count the number of rows in a data table that meet specific conditions. This article will introduce how to use MySQL's COUNT function to count the number of rows in a data table, and provide relevant code examples. The syntax of the COUNT function is as follows: SELECTCOUNT(column_name)FROMtable_nameWHEREconditi As one of the commonly used office software, Excel is an indispensable good partner in our life and work. We often use it to count people, which is also the most common operation. For veterans who are familiar with Excel, using it to count people is a matter of minutes; but if you are a novice, using ecxel to count people is simply difficult! So how to use it? I compiled a document today, I hope it can help you! Let’s take a look together! Method 1: [Use functions to count people] (as shown in the picture) We enter [=COUNT(B2:B6)] in the bottom unit cell; then, press [Enter] to get the number of people. Method 2: [Use the status bar to count people] (as shown in the picture). 1. We click the mouse单元格,还需要在tr里面添加10多个单元格 对象,每个单元格 对象内要添加文本框对象,还需要在文本框对象上响应onblur事件进行运费计算,代码量相当大。
关键代码
(一)创建克隆单元格对象并添加到表格中
var v=$("#tbin");//得到表格的jquery对象
//所有的数据行有一个.MyRow的Class,得到数据行的大小
var vcount=$("#tbin tr").filter(".MyRow").size() 1;//表格有多少个数据行
var vTr=$("#tbin #trDataRow1"); //得到表格中的第一行数据
var vTrClone=vTr.clone(true);//创建第一行的副本对象vTrClone
vTrClone.appendTo(v);//把副本单元格对象添加到表格下方
(二)统计更新总金额
function UpdateTotal()//更新总金额
{
var vTotalMoney=0;//总金额的初始值为0;
var vTable=$("#tbin");//得到表格的jquery对象
var vTotal= vTable.find("#txtTotal") ;//得到总金额对象
var vtxtAfters=vTable.find("#txtMoney");//得到所有计算好的费用对象;
vtxtAfters.each( //使用jQuery的each函数遍历每行费用对象,累加成总金额
function(i)
{
var vTempValue=$(this).val();
if(vTempValue=="")
{
vTempValue=0;
}
vTotalMoney=vTotalMoney parseFloat(vTempValue);//计算总费用
}
)//遍历结束
vTotal.val(vTotalMoney); //将总费用显示到对应文本框对象中
}
(三)计费重量变化时计算费用,并统计总费用
$("#txtMoneyWeight").bind("change", function()
{
var vTotalMoney=0;//总金额的初始值为0;
var vtxtDetail=$(this);//得到变化的文本框对象
var vVal=vtxtDetail.val();
var vtxtAfter=vtxtDetail.parent("td").parent("tr").find("#txtRate");//得到费率;
var vtxtMoney=vtxtDetail.parent("td").parent("tr").find("#txtMoney");//得到费用;
var vMoney=CalculatorMoney(vVal,vtxtAfter.val());//使用公式计算单行运费
vtxtMoney.val(vMoney); //显示单行运费信息
UpdateTotal(); //调用函数统计更新总费用
}); //变化脚本结束
键盘的控制和数据的校验在源程序中有详细注释,具体代码可参考源程序。
Hot AI Tools

Undresser.AI Undress

AI Clothes Remover

Undress AI Tool

Clothoff.io

Video Face Swap

Hot Article
Hot Tools

Notepad++7.3.1

SublimeText3 Chinese version

Zend Studio 13.0.1

Dreamweaver CS6

SublimeText3 Mac version
Hot Topics
 How to implement data statistics and analysis in uniapp
Oct 24, 2023 pm 12:37 PM
How to implement data statistics and analysis in uniapp
Oct 24, 2023 pm 12:37 PM
 Implementation of linear and pie chart functions in Vue statistical charts
Aug 19, 2023 pm 06:13 PM
Implementation of linear and pie chart functions in Vue statistical charts
Aug 19, 2023 pm 06:13 PM
 How to use SQL statements for data aggregation and statistics in MySQL?
Dec 17, 2023 am 08:41 AM
How to use SQL statements for data aggregation and statistics in MySQL?
Dec 17, 2023 am 08:41 AM
 How to quickly build a statistical chart system under the Vue framework
Aug 21, 2023 pm 05:48 PM
How to quickly build a statistical chart system under the Vue framework
Aug 21, 2023 pm 05:48 PM
 Steps of statistical analysis
Jun 28, 2023 pm 03:27 PM
Steps of statistical analysis
Jun 28, 2023 pm 03:27 PM
 Use Google Analytics to count website data in Beego
Jun 22, 2023 am 09:19 AM
Use Google Analytics to count website data in Beego
Jun 22, 2023 am 09:19 AM
 How to use MySQL's COUNT function to count the number of rows in a data table
Jul 25, 2023 pm 02:09 PM
How to use MySQL's COUNT function to count the number of rows in a data table
Jul 25, 2023 pm 02:09 PM
 Do you know how to count people in excel?
Mar 20, 2024 pm 01:30 PM
Do you know how to count people in excel?
Mar 20, 2024 pm 01:30 PM


