
 Web Front-end
H5 Tutorial
Detailed explanation of HTML5 network topology map integrating OpenLayers to implement GIS map application (picture)
Web Front-end
H5 Tutorial
Detailed explanation of HTML5 network topology map integrating OpenLayers to implement GIS map application (picture)
Detailed explanation of HTML5 network topology map integrating OpenLayers to implement GIS map application (picture)

HT for Web, as a logical topology graphics component, does not have GIS functions, but it can be integrated with various GIS engines, i.e., its client components, to achieve seamless integration of logical topology and physical topology. This chapter will introduce in detail The key technical points of the combined application of HT for Web and the development of free OpenLayers maps. The principles of the combination introduced in this article can actually be extended to solutions integrated with many GIS map engines such as ArcGIS, Baidu Maps, and Google Maps.
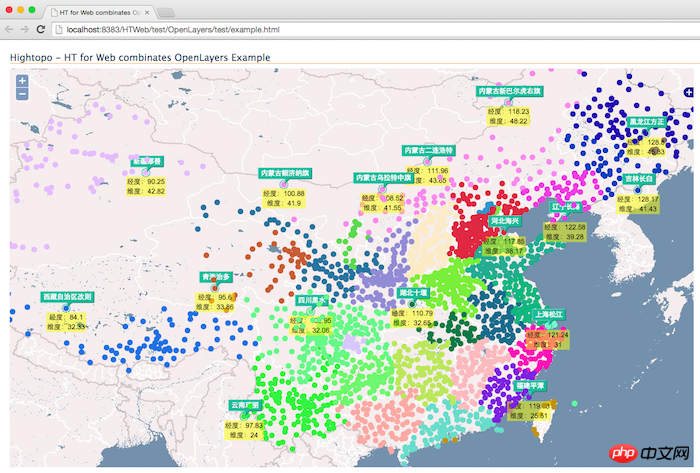
The above screenshot is the final running effect of the example introduced in this article. Next, we will implement it step by step. The preferred display of map information requires city longitude and latitude data, search Thank you for the data provided by this blog. For such a large amount of data, I use the getRawText function method introduced in "HT Graphic Component Design (4)". After having the data, the only remaining problem is presentation. We need to convert HT's GraphView The component is superimposed on the map component of OpenLayers, that is, the tile map image of OpenLayers is at the bottom, and the component of GraphView is at the top. Since GraphView is transparent by default, users in non-graphic elements can see through the map content. Finding the appropriate insertion location for components is a headache. Almost every different GIS component in ArcGIS, Baidu Maps, including Google Maps requires a trial to find the appropriate insertion location. The integration of other GIS engine components will be introduced in later chapters. In this article, we focus on The insertion method of OpenLayers is map.viewPortp.appendChild(graphView.getView()).
After the HT and OpenLayers components are superimposed, the remaining problem is the combination of the placement of the primitives in the topology and the longitude and latitude. The position of the primitives stored in ht.Node in the conventional network topology diagram is the logical position. It has nothing to do with longitude and latitude, so in GIS applications we need to convert the screen logical coordinate information of position based on the longitude and latitude information of the graphic element. If you know the projection algorithm, you can also provide function processing yourself, but all GIS components provide similar APIs. Functions for calling. Of course, this part is not standardized. Different GIS components need to call different APIs, but the basic principle is the same. For OpenLayers, we can convert the latitude and longitude information into screen pixels through map.getPixelFromLonLat(data.lonLat) Logical coordinates, that is, the position coordinate information required by ht.Node.
Careful students will think that the conversion is two-way. It is possible that the user needs to drag the primitive node to change its longitude and latitude information. At this time, we need another direction function, that is, convert the logical coordinates of the screen into the current coordinates. The longitude and latitude, in OpenLayers we can get it through map.getLonLatFromPixel(new OpenLayers.Pixel(x, y));
After the display is done, the only remaining problem is interaction. HT has its own interaction system, and OpenLayers also needs map roaming and zoom interaction. How to combine the two? It would be best if the functions of both can be retained. The answer is yes, we only need to add mousedown or touchstart event monitoring. If graphView.getDataAt(e) selects the graph element, we will stop it through e.stopPropagation(); Event propagation, so that the map map will not respond. At this time, HT takes over the interaction. If the element is not selected, map takes over the interaction of the map operation.
The above interaction design seems to be perfect, but when running, I found several pitfalls that took me a long time to find the solution:
Setting map.events.fallThrough = true; otherwise map will not transparently transmit events to HT's GraphView component
graphView.getView().style.zIndex = 999; You need to specify a certain zIndex otherwise it will be blocked
graphView.getView().className = 'olScrollable'; Otherwise the scroll wheel will not respond to map zoom
Set ht.Default.baseZIndex: 1000 Otherwise, the ToolTip will be obscured
In order to make this example more user-friendly, I also made some technical points for reference:
Adopted The open source free llllll.li/randomColor/random color library, which also has many great color acquisition functions, I just simply display different colors for each province
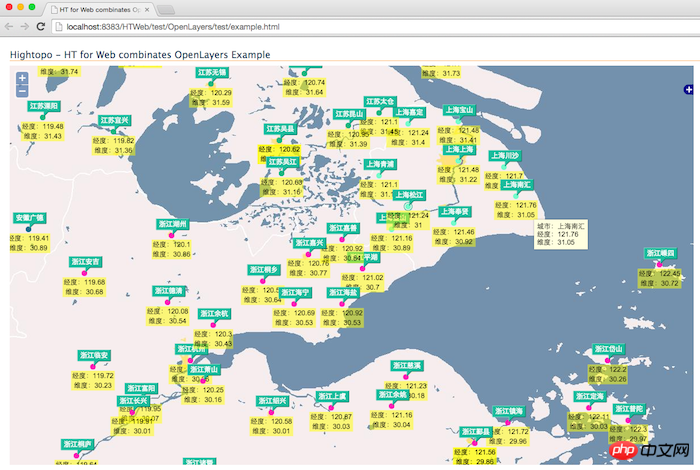
Overloaded isVisible, isNoteVisible and isLabelVisible will only display more detailed content when the zoom reaches a certain level. Otherwise, all city information will be displayed completely unviewable when zoomed out. This can improve the display performance


function init(){
graphView = new ht.graph.GraphView();
var view = graphView.getView();
map = new OpenLayers.Map("map");
var ol_wms = new OpenLayers.Layer.WMS(
"OpenLayers WMS",
"http://vmap0.tiles.osgeo.org/wms/vmap0",
{layers: "basic"}
);
map.addLayers([ol_wms]);
map.addControl(new OpenLayers.Control.LayerSwitcher());
map.zoomToMaxExtent();
map.events.fallThrough = true;
map.zoomToProxy = map.zoomTo;
map.zoomTo = function (zoom,xy){
view.style.opacity = 0;
map.zoomToProxy(zoom, xy);
console.log(zoom);
};
map.events.register("movestart", this, function() {
});
map.events.register("move", this, function() {
});
map.events.register("moveend", this, function() {
view.style.opacity = 1;
reset();
});
graphView.getView().className = 'olScrollable';
graphView.setScrollBarVisible(false);
graphView.setAutoScrollZone(-1);
graphView.handleScroll = function(){};
graphView.handlePinch = function(){};
graphView.mi(function(e){
if(e.kind === 'endMove'){
graphView.sm().each(function(data){
if(data instanceof ht.Node){
var position = data.getPosition(),
x = position.x + graphView.tx(),
y = position.y + graphView.ty();
data.lonLat = map.getLonLatFromPixel(new OpenLayers.Pixel(x, y));
}
});
}
});
graphView.enableToolTip();
graphView.getToolTip = function(event){
var data = this.getDataAt(event);
if(data){
return '城市:' + data.s('note') + '
经度:' + data.lonLat.lon + '
维度:' + data.lonLat.lat;
}
return null;
};
graphView.isVisible = function(data){
return map.zoom > 1 || this.isSelected(data);
};
graphView.isNoteVisible = function(data){
return map.zoom > 6 || this.isSelected(data);
};
graphView.getLabel = function(data){
return '经度:' + data.lonLat.lon + '\n维度:' + data.lonLat.lat;
};
graphView.isLabelVisible = function(data){
return map.zoom > 7 || this.isSelected(data);
};
view.addEventListener("ontouchend" in document ? 'touchstart' : 'mousedown', function(e){
var data = graphView.getDataAt(e);
if(data || e.metaKey || e.ctrlKey){
e.stopPropagation();
}
}, false);
view.style.position = 'absolute';
view.style.top = '0';
view.style.left = '0';
view.style.right = '0';
view.style.bottom = '0';
view.style.zIndex = 999;
map.viewPortp.appendChild(view);
var color = randomColor();
lines = china.split('\n');
for(var i=0; i<lines.length; i++) {
line = lines[i].trim();
if(line.indexOf('【') === 0){
//province = line.substring(1, line.length-1);
color = randomColor();
}else{
var ss = line.split(' ');
if(ss.length === 3){
createNode(parseFloat(ss[1].substr(3)), parseFloat(ss[2].substr(3)), ss[0].substr(3), color);
}
}
}
}
function reset(){
graphView.tx(0);
graphView.ty(0);
graphView.dm().each(function(data){
if(data.lonLat){
data.setPosition(map.getPixelFromLonLat(data.lonLat));
}
});
graphView.validate();
}
function createNode(lon, lat, name, color){
var node = new ht.Node();
node.s({
'shape': 'circle',
'shape.background': color,
'note': name,
'label.background': 'rgba(255, 255, 0, 0.5)',
'select.type': 'circle'
});
node.setSize(10, 10);
var lonLat = new OpenLayers.LonLat(lon, lat);
lonLat.transform('EPSG:4326', map.getProjectionObject());
node.setPosition(map.getPixelFromLonLat(lonLat));
node.lonLat = lonLat;
graphView.dm().add(node);
return node;
}
The above is the detailed content of Detailed explanation of HTML5 network topology map integrating OpenLayers to implement GIS map application (picture). For more information, please follow other related articles on the PHP Chinese website!

Hot AI Tools

Undresser.AI Undress
AI-powered app for creating realistic nude photos

AI Clothes Remover
Online AI tool for removing clothes from photos.

Undress AI Tool
Undress images for free

Clothoff.io
AI clothes remover

Video Face Swap
Swap faces in any video effortlessly with our completely free AI face swap tool!

Hot Article
Hot Tools

Notepad++7.3.1
Easy-to-use and free code editor

SublimeText3 Chinese version
Chinese version, very easy to use

Zend Studio 13.0.1
Powerful PHP integrated development environment

Dreamweaver CS6
Visual web development tools

SublimeText3 Mac version
God-level code editing software (SublimeText3)
Hot Topics


 Table Border in HTML
Sep 04, 2024 pm 04:49 PM
Table Border in HTML
Sep 04, 2024 pm 04:49 PM
Guide to Table Border in HTML. Here we discuss multiple ways for defining table-border with examples of the Table Border in HTML.
 Nested Table in HTML
Sep 04, 2024 pm 04:49 PM
Nested Table in HTML
Sep 04, 2024 pm 04:49 PM
This is a guide to Nested Table in HTML. Here we discuss how to create a table within the table along with the respective examples.
 HTML margin-left
Sep 04, 2024 pm 04:48 PM
HTML margin-left
Sep 04, 2024 pm 04:48 PM
Guide to HTML margin-left. Here we discuss a brief overview on HTML margin-left and its Examples along with its Code Implementation.
 HTML Table Layout
Sep 04, 2024 pm 04:54 PM
HTML Table Layout
Sep 04, 2024 pm 04:54 PM
Guide to HTML Table Layout. Here we discuss the Values of HTML Table Layout along with the examples and outputs n detail.
 HTML Input Placeholder
Sep 04, 2024 pm 04:54 PM
HTML Input Placeholder
Sep 04, 2024 pm 04:54 PM
Guide to HTML Input Placeholder. Here we discuss the Examples of HTML Input Placeholder along with the codes and outputs.
 HTML Ordered List
Sep 04, 2024 pm 04:43 PM
HTML Ordered List
Sep 04, 2024 pm 04:43 PM
Guide to the HTML Ordered List. Here we also discuss introduction of HTML Ordered list and types along with their example respectively
 Moving Text in HTML
Sep 04, 2024 pm 04:45 PM
Moving Text in HTML
Sep 04, 2024 pm 04:45 PM
Guide to Moving Text in HTML. Here we discuss an introduction, how marquee tag work with syntax and examples to implement.
 HTML onclick Button
Sep 04, 2024 pm 04:49 PM
HTML onclick Button
Sep 04, 2024 pm 04:49 PM
Guide to HTML onclick Button. Here we discuss their introduction, working, examples and onclick Event in various events respectively.
