

This article teaches you how to correctly package ECharts

This article brings you relevant knowledge about ECharts. It mainly talks about how to encapsulate ECharts. Friends who are interested can take a look below. I hope it will be helpful to everyone.
The beginning of the article is always difficult, so I won’t say more
This article involves: TypeScript, Vue3, echarts
Because of ECharts The usage scenarios are extremely broad, and there are many customized scenarios, so we won’t encapsulate reusable components. In my opinion, each component still needs an independent option. Here we only encapsulate the echats that are better to use
Directory
|--src
    |--components     // 组件
        |--echarts    // echats 封装目录
            |--echarts-types.ts    // 一些类型
            |--library.ts          // 为 echats 增加的一些功能
            |--useECharts.ts       // 主函数

        |--EChartsComponents
            |--a-echarts.vue      // 组件使用

|--App.vue
Code
library.ts
is introduced centrally in library.ts and mounts echarts Components and functions that need to be used
import * as echarts from 'echarts/core';

import {
        BarChart,
        LineChart,
        PieChart,
        MapChart,
        PictorialBarChart,
        RadarChart,
        ScatterChart
} from 'echarts/charts';

import {
        TitleComponent,
        TooltipComponent,
        GridComponent,
        PolarComponent,
        AriaComponent,
        ParallelComponent,
        LegendComponent,
        RadarComponent,
        ToolboxComponent,
        DataZoomComponent,
        VisualMapComponent,
        TimelineComponent,
        CalendarComponent,
        GraphicComponent
} from 'echarts/components';

echarts.use([
        LegendComponent,
        TitleComponent,
        TooltipComponent,
        GridComponent,
        PolarComponent,
        AriaComponent,
        ParallelComponent,
        BarChart,
        LineChart,
        PieChart,
        MapChart,
        RadarChart,
        PictorialBarChart,
        RadarComponent,
        ToolboxComponent,
        DataZoomComponent,
        VisualMapComponent,
        TimelineComponent,
        CalendarComponent,
        GraphicComponent,
        ScatterChart
]);

export default echarts;echarts-types.ts
Some types that need to be used are specified here
export enum RenderType {
        SVGRenderer = 'SVGRenderer',
        CanvasRenderer = 'SVGRenderer'
}

export enum ThemeType {
        Light = 'light',
        Default = 'default',
}useECharts.ts Main file
Introduce the functional modules that need to be used. The EChartsOption type is easy to report red when used. Here we temporarily use any
import { onMounted, onUnmounted, Ref, unref } from "vue";
import echarts from "./library";
// import type { EChartsOption } from 'echarts'
import { SVGRenderer, CanvasRenderer } from 'echarts/renderers'
import { RenderType, ThemeType } from './echarts-types'
export function useECharts(elparams: Ref<HTMLDivElement> | HTMLDivElement, autoUpdateSize: boolean = false, render: RenderType = RenderType.SVGRenderer, theme = ThemeType.Default) {
// 渲染模式
echarts.use(render === RenderType.SVGRenderer ? SVGRenderer : CanvasRenderer)
// echats实例
let echartsInstance: echarts.ECharts | null = null
// 初始化 echats实例
function initCharts() {
const el = unref(elparams)
if (!el) return
echartsInstance = echarts.init(el, theme)
}
// 配置
function setOption(option: any) {
showLoading()
if (!echartsInstance) initCharts()
if (!echartsInstance) return
echartsInstance.setOption(option)
hideLoading()
}
// 获取 echats实例
function getInstance() {
if (!echartsInstance) initCharts()
return echartsInstance
}
// 更新大小
function onResize() {
echartsInstance?.resize()
}
// 监听元素大小变化
function watchEl() {
if (animation) unref(elparams).style.transition = 'width 1s, height 1s'
const resizeObserve = new ResizeObserver(() => onResize())
resizeObserve.observe(unref(elparams))
}
// 显示加载状态
function showLoading() {
if (!echartsInstance) initCharts()
echartsInstance?.showLoading()
}
// 隐藏加载状态
function hideLoading() {
if (!echartsInstance) initCharts()
echartsInstance?.hideLoading()
}
// 生命钩子——组件挂载完成
onMounted(() => {
window.addEventListener('resize', onResize)
if (autoUpdateSize) watchEl()
})
// 生命钩子——页面销毁
onUnmounted(() => {
window.removeEventListener('resize', onResize)
})
return { setOptions, getInstance }
}to use it in the component
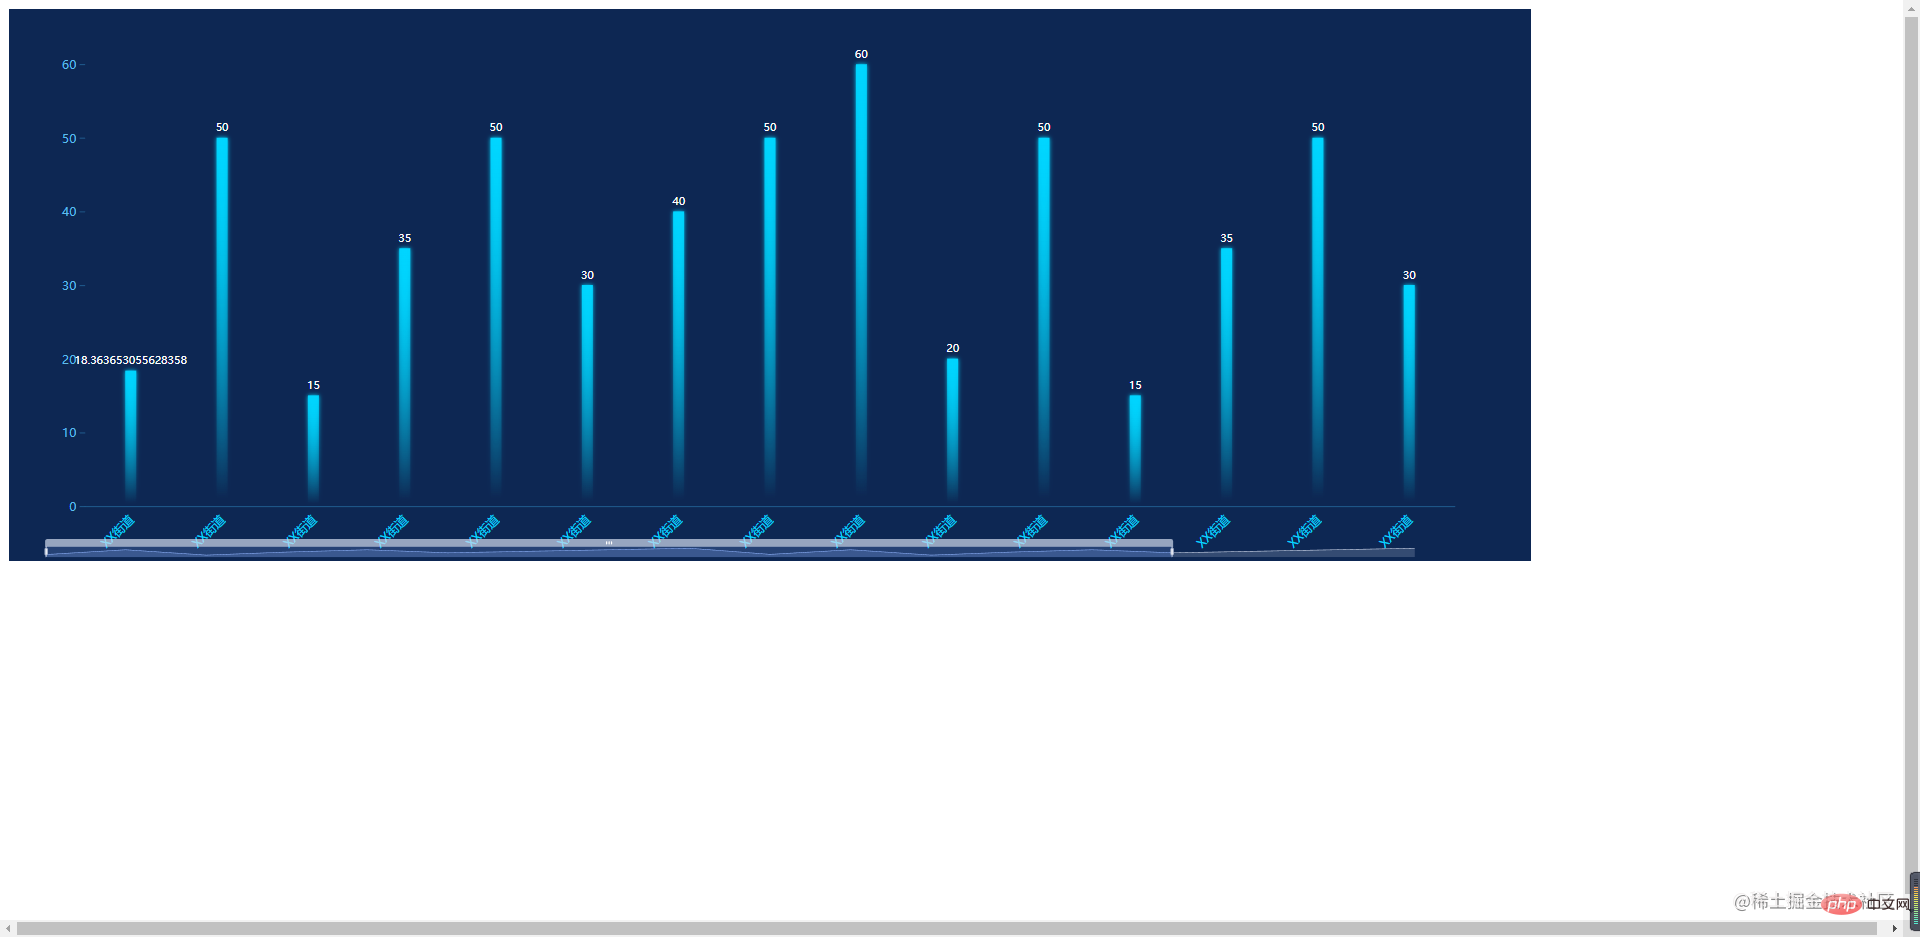
a-echarts.vue. We only use it now. You need to find some options to implement different charts
This is a good website with many examplesPPChart Let’s try any one,
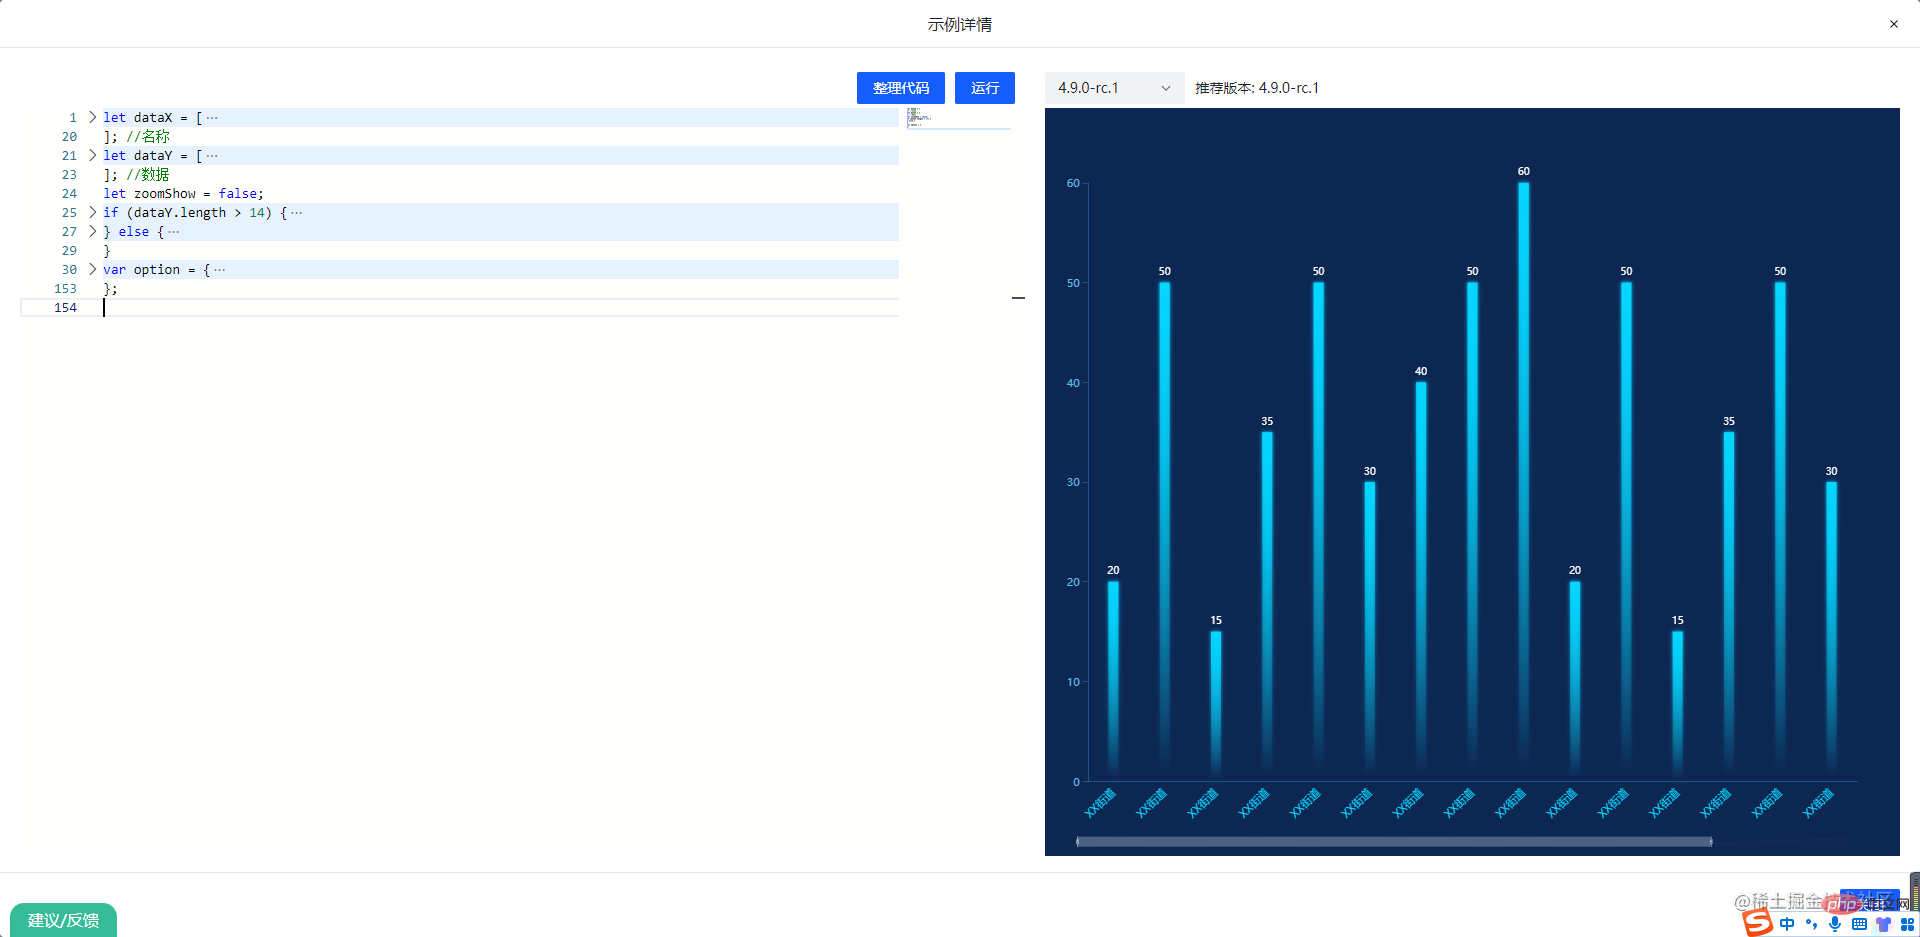
Copy the configuration code below and you can see the effect
<template>
        <div ref="MyEcharts"></div>
</template>

<script setup>
import { onMounted, Ref, ref } from "vue";
import echarts from "../echarts/library";

//获取echarts实例
const MyEcharts = ref<HTMLDivElement | null>(null)

const { setOption, getInstance } = useECharts(MyEcharts as Ref<HTMLDivElement>, false, true)

onMounted(() => {

        setOption(option);

        const echartsInstance = getInstance()

})

</script>App.vue
<template> <echarts></echarts> </template> <script setup> import echarts from './components/EchartsComponents/a-echarts.vue' </script> <style scoped></style>
Finished! If you find it helpful, please leave a like! ! !
Recommended learning: "vue.js video tutorial"
The above is the detailed content of This article teaches you how to correctly package ECharts. For more information, please follow other related articles on the PHP Chinese website!

Hot AI Tools

Undresser.AI Undress
AI-powered app for creating realistic nude photos

AI Clothes Remover
Online AI tool for removing clothes from photos.

Undress AI Tool
Undress images for free

Clothoff.io
AI clothes remover

Video Face Swap
Swap faces in any video effortlessly with our completely free AI face swap tool!

Hot Article
Hot Tools

Notepad++7.3.1
Easy-to-use and free code editor

SublimeText3 Chinese version
Chinese version, very easy to use

Zend Studio 13.0.1
Powerful PHP integrated development environment

Dreamweaver CS6
Visual web development tools

SublimeText3 Mac version
God-level code editing software (SublimeText3)
Hot Topics
 1667
1667
 14
1426
52
1328
25
1273
29
1255
24
14
1426
52
1328
25
1273
29
1255
24

 PHP and Vue: a perfect pairing of front-end development tools
Mar 16, 2024 pm 12:09 PM
PHP and Vue: a perfect pairing of front-end development tools
Mar 16, 2024 pm 12:09 PM
PHP and Vue: a perfect pairing of front-end development tools. In today's era of rapid development of the Internet, front-end development has become increasingly important. As users have higher and higher requirements for the experience of websites and applications, front-end developers need to use more efficient and flexible tools to create responsive and interactive interfaces. As two important technologies in the field of front-end development, PHP and Vue.js can be regarded as perfect tools when paired together. This article will explore the combination of PHP and Vue, as well as detailed code examples to help readers better understand and apply these two
 Is Django front-end or back-end? check it out!
Jan 19, 2024 am 08:37 AM
Is Django front-end or back-end? check it out!
Jan 19, 2024 am 08:37 AM
Django is a web application framework written in Python that emphasizes rapid development and clean methods. Although Django is a web framework, to answer the question whether Django is a front-end or a back-end, you need to have a deep understanding of the concepts of front-end and back-end. The front end refers to the interface that users directly interact with, and the back end refers to server-side programs. They interact with data through the HTTP protocol. When the front-end and back-end are separated, the front-end and back-end programs can be developed independently to implement business logic and interactive effects respectively, and data exchange.
 Exploring Go language front-end technology: a new vision for front-end development
Mar 28, 2024 pm 01:06 PM
Exploring Go language front-end technology: a new vision for front-end development
Mar 28, 2024 pm 01:06 PM
As a fast and efficient programming language, Go language is widely popular in the field of back-end development. However, few people associate Go language with front-end development. In fact, using Go language for front-end development can not only improve efficiency, but also bring new horizons to developers. This article will explore the possibility of using the Go language for front-end development and provide specific code examples to help readers better understand this area. In traditional front-end development, JavaScript, HTML, and CSS are often used to build user interfaces
 Does ECharts depend on jQuery? In-depth analysis
Feb 27, 2024 am 08:39 AM
Does ECharts depend on jQuery? In-depth analysis
Feb 27, 2024 am 08:39 AM
Does ECharts need to rely on jQuery? Detailed interpretation requires specific code examples. ECharts is an excellent data visualization library that provides a rich range of chart types and interactive functions and is widely used in web development. When using ECharts, many people will have a question: Does ECharts need to rely on jQuery? This article will explain this in detail and give specific code examples. First, to be clear, ECharts itself does not rely on jQuery;
 Django: A magical framework that can handle both front-end and back-end development!
Jan 19, 2024 am 08:52 AM
Django: A magical framework that can handle both front-end and back-end development!
Jan 19, 2024 am 08:52 AM
Django: A magical framework that can handle both front-end and back-end development! Django is an efficient and scalable web application framework. It is able to support multiple web development models, including MVC and MTV, and can easily develop high-quality web applications. Django not only supports back-end development, but can also quickly build front-end interfaces and achieve flexible view display through template language. Django combines front-end development and back-end development into a seamless integration, so developers don’t have to specialize in learning
 Questions frequently asked by front-end interviewers
Mar 19, 2024 pm 02:24 PM
Questions frequently asked by front-end interviewers
Mar 19, 2024 pm 02:24 PM
In front-end development interviews, common questions cover a wide range of topics, including HTML/CSS basics, JavaScript basics, frameworks and libraries, project experience, algorithms and data structures, performance optimization, cross-domain requests, front-end engineering, design patterns, and new technologies and trends. . Interviewer questions are designed to assess the candidate's technical skills, project experience, and understanding of industry trends. Therefore, candidates should be fully prepared in these areas to demonstrate their abilities and expertise.
 Combination of Golang and front-end technology: explore how Golang plays a role in the front-end field
Mar 19, 2024 pm 06:15 PM
Combination of Golang and front-end technology: explore how Golang plays a role in the front-end field
Mar 19, 2024 pm 06:15 PM
Combination of Golang and front-end technology: To explore how Golang plays a role in the front-end field, specific code examples are needed. With the rapid development of the Internet and mobile applications, front-end technology has become increasingly important. In this field, Golang, as a powerful back-end programming language, can also play an important role. This article will explore how Golang is combined with front-end technology and demonstrate its potential in the front-end field through specific code examples. The role of Golang in the front-end field is as an efficient, concise and easy-to-learn
 Vue.js vs. React: Project-Specific Considerations
Apr 09, 2025 am 12:01 AM
Vue.js vs. React: Project-Specific Considerations
Apr 09, 2025 am 12:01 AM
Vue.js is suitable for small and medium-sized projects and fast iterations, while React is suitable for large and complex applications. 1) Vue.js is easy to use and is suitable for situations where the team is insufficient or the project scale is small. 2) React has a richer ecosystem and is suitable for projects with high performance and complex functional needs.
