

-

- vscode控制台怎么打开
- 打开 Visual Studio Code 控制台的方法:快捷键:Windows/Linux:Ctrl + ~macOS:Cmd + ~菜单栏:“查看”>“集成终端”工具栏:“终端”图标命令面板:Ctrl + Shift + P (Windows/Linux) 或 Cmd + Shift + P (macOS),输入“Terminal”键盘快捷键:F1,输入“Open New Terminal”
- 开发工具 . visual-studio-code 4555 2024-05-27 12:18:18
-

- vscode怎么改中文
- Visual Studio Code(VSCode)可以更改为中文界面。步骤如下:打开设置菜单(Windows 和 Linux:Ctrl + ,;macOS:Cmd + ,)选择 "Text Editor",找到 "Language" 选项从下拉菜单中选择 "简体中文" 或 "繁体中文"重启 VSCode,界面将更改为所选的中文语言
- 开发工具 . visual-studio-code 9697 2024-09-06 09:46:46
-

- vscode怎么删除快捷键
- 在 Visual Studio Code 中删除快捷键有两种方法:使用快捷键 Ctrl + K + K 打开命令面板,搜索 "Keybindings",找到并点击垃圾桶图标删除快捷键。使用 JSON 文件编辑器打开 "Preferences: Open Settings (JSON)",在 "keybindings" 部分删除对应的快捷键条目,保存 JSON 文件并重启 VSCode 生效。
- 开发工具 . visual-studio-code 1370 2024-05-27 12:03:19
-

- vscode怎么运行nodejs
- 可以使用 Visual Studio Code (VS Code) 运行 Node.js 代码,步骤包含:安装 Node.js打开 VS Code配置 VS Code 以支持 Node.js创建 Node.js 文件编写 Node.js 代码使用“终端”面板或“运行调试”运行代码
- 开发工具 . visual-studio-code 4058 2024-05-27 11:57:19
-

- vscode怎么用css
- 教程介绍了如何使用 Visual Studio Code 编写 CSS。首先安装软件,然后创建并编辑一个 CSS 文件,用基本的 CSS 代码设置背景色和字体。保存文件后,将其与 HTML 文件关联。最后,在浏览器中预览结果。Visual Studio Code 还提供代码补全、语法高亮和错误检查等有用功能,以及增强工作流程的插件。
- 开发工具 . visual-studio-code 3178 2024-05-27 11:51:20
-

- vscode怎么用npm运行
- 如何使用 VSCode 通过 NPM 运行 JavaScript 代码?安装 Node.js 和 VSCode。创建 JavaScript 文件并编写代码。在 VSCode 中打开终端。安装依赖项(可选)。运行 JavaScript 文件:npm run start。
- 开发工具 . visual-studio-code 2259 2024-05-27 11:45:31
-

- vscode怎么配置python路径
- 如何配置 Visual Studio Code 中的 Python 路径?验证 Python 是否已安装。将 Python 添加到路径:Windows:在 "路径" 变量中添加 Python 解释器路径。macOS:运行 "export PATH=/path/to/python:$PATH" 命令。Linux:运行 "export PATH=/path/to/python:$PATH" 命令。重启 VS Code 使路径更改生效。验证路径配置:在 VS Code 终端中运行 "which pyt
- 开发工具 . visual-studio-code 3527 2024-05-27 11:36:19
-

- vscode控制台怎么用
- 回答: Visual Studio Code(VSCode)的控制台允许开发者直接在代码编辑器中运行命令和脚本。详细描述:打开控制台:使用快捷键 (Ctrl + ~ 或 Command + ~) 或从菜单栏中导航。运行命令:输入命令或脚本路径后回车。调试应用程序:设置断点并运行应用程序,控制台会输出信息并在断点处暂停。输出信息:应用程序和脚本会在控制台中输出信息和错误。更改目录:使用 cd 命令。设置环境变量:使用 export 命令。注意:控制台使用命令行界面,需要了解基本语法,命令在操作系统
- 开发工具 . visual-studio-code 1771 2024-05-27 11:30:32
-

- vscode界面怎么缩放
- 在 Visual Studio Code 中缩放界面可以通过以下方式:使用键盘快捷键(Ctrl/Command + 鼠标滚轮);通过“视图”菜单选择缩放比例;在命令面板输入“Zoom In”或“Zoom Out”执行命令;在“设置”中调整“默认缩放因子”。
- 开发工具 . visual-studio-code 7128 2024-05-27 11:27:15
-

- vscode怎么编译运行vue
- 在 Visual Studio Code 中编译和运行 Vue.js 项目的步骤:安装 Vue.js CLI:npm install -g @vue/cli创建项目:vue create my-project进入项目目录:cd my-project运行开发服务器:npm run serve编译项目:npm run build运行编译后的项目:serve -s dist
- 开发工具 . visual-studio-code 1511 2024-05-27 11:24:17
-

- vscode怎么启动vue
- 如何在 Visual Studio Code 中启动 Vue 项目?安装 Vue CLI:npm install -g @vue/cli创建 Vue 项目:cd my-vue-project && vue create my-vue-project启动 Vue 项目:npm run serve
- 开发工具 . visual-studio-code 1619 2024-05-27 11:21:16
-

- vscode不小心撤销了怎么还原
- 如果您在 Visual Studio Code 中不小心撤销了操作,您可以:立即按 Ctrl+Z (Windows/Linux) 或 Cmd+Z (macOS) 恢复撤销的操作。使用撤销历史记录 (Ctrl+Shift+U 或 Cmd+Shift+Z) 来恢复被撤销的操作。使用 redo 命令 (Ctrl+Y 或 Cmd+Y) 来恢复被撤销的操作。
- 开发工具 . visual-studio-code 3811 2024-05-27 11:09:15
-

- vscode怎么创建一个c项目
- 在 Visual Studio Code 中创建 C 项目:1. 安装 C/C++ 和 CMake Tools 扩展。2. 创建新文件夹和 CMakeLists.txt 文件。3. 创建 main.cpp 文件。4. 构建项目。5. 按 F5 调试或按 Ctrl + F5 在终端中运行项目。
- 开发工具 . visual-studio-code 4307 2024-05-27 11:06:17
-

- vscode怎么创建html
- 在 Visual Studio Code 中创建 HTML 文件的步骤:打开 VSCode 并新建一个文件;从 "语言" 列表中选择 HTML;为文件命名,例如 "index.html";输入 HTML 代码,例如:html <!DOCTYPE html><html><head><title>我的第一个 HTML 页面</title></head><body><h1>欢迎来到我的网站!</h1&
- 开发工具 . visual-studio-code 4775 2024-05-27 11:03:19
-

- vscode怎么搜索文件
- 使用 Visual Studio Code(VSCode)搜索文件的方法为:使用快捷键 Ctrl/Cmd + Shift + F 打开搜索框。输入文件名或内容,并可使用通配符、正则表达式和排除语法。指定搜索范围:当前文件、活动文件、工作区或全局。预览搜索结果并在列表中单击文件以打开。
- 开发工具 . visual-studio-code 5794 2024-05-27 11:00:38

PHP讨论组
组员:3305人话题:1500
PHP一种被广泛应用的开放源代码的多用途脚本语言,和其他技术相比,php本身开源免费; 可以将程序嵌入于HTML中去执行, 执行效率比完全生成htmL标记的CGI要高许多,它运行在服务器端,消耗的系统资源相当少,具有跨平台强、效率高的特性,而且php支持几乎所有流行的数据库以及操作系统,最重要的是


工具推荐


斯摩派(smapie)企业建站程序
一个让ASP程序轻松做最少的代码编写量,一般企业所需要的功能都有,参数设置,数据库管理,文件管理,数据初始化,生成HTML页面(这是为了某些客户需要静态页面的需求),页面管理(这里是为了网站中某些单页面需求而开发的,这里你在前台只要用sub_c.article(2) 这个2是这里的id号,也可以是在比如index.asp?id=2 是一样的效果)公告管理,友情链接,信息发布(这里有分类,分类是无限分级),产品发布(这里有分类,分类是无限分级),订单管理,人才管理,留言管理,会员管理后台为域名/manag
企业站源码
2025-10-26
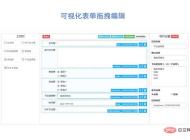
YZCMS企业网站管理系统1.1
YZCMS企业网站管理系统基于ThinkPHP3.2开发构建的企业网站管理系统,它具有操作简单、功能强大、稳定性好、扩展性及安全性强、二次开发及后期维护方便,可以帮您迅速、轻松地构建起一个强大专业的企业网站。
企业站源码
2025-10-26

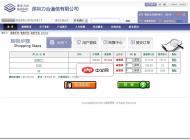
动感购物多用户商城系统 多用户版本(带论坛)
动感购物多用户商城系统,是在网络上建立一个虚拟商场,避免了挑选商品的烦琐过程,使您的购物过程变得轻松、快捷、方便,很适合现代人快节奏的生活;同时又能有效的控制商场运营的成本,开辟了一个新的销售渠道管理员帐号:admin管理员密码:1234论坛帐号:admin管理员密码:chinaz
电商源码
2025-10-26

马油膏护肤品竖版宣传banner设计下载
马油膏护肤品竖版宣传banner设计适用于护肤品宣传banner设计 本作品提供马油膏护肤品竖版宣传banner设计的图片会员免费下载,格式为PSD,文件大小为28.2M; 请使用软件Photoshop进行编辑,作品中文字及图均可以通过软件修改和编辑;
psd素材
2025-10-26

美味餐饮食物横幅设计PS素材下载
美味餐饮食物横幅设计PS素材适用于餐饮美食横幅设计 本作品提供美味餐饮食物横幅设计PS素材的图片会员免费下载,格式为PSD,文件大小为0.9M; 请使用软件Photoshop进行编辑,作品中文字及图均可以通过软件修改和编辑;
psd素材
2025-10-26


驾照考试驾校HTML5网站模板
驾照考试驾校HTML5网站模板是一款适合提供驾驶培训和组织驾照考试服务机构宣传网站模板下载。提示:本模板调用到谷歌字体库,可能会出现页面打开比较缓慢。
前端模板
2025-06-10

驾照培训服务机构宣传网站模板
驾照培训服务机构宣传网站模板是一款适合提供一般驾驶和计划培训的驾校宣传网站模板下载。提示:本模板调用到谷歌字体库,可能会出现页面打开比较缓慢。
前端模板
2025-01-07


HTML5房地产公司宣传网站模板
HTML5房地产公司宣传网站模板是一款适合从事房地产服务行业宣传网站模板下载。提示:本模板调用到谷歌字体库,可能会出现页面打开比较缓慢。
前端模板
2025-01-06


