

jQuery LigerUI operation form
这次给大家带来jQuery LigerUI操作表格,jQuery LigerUI操作表格的注意事项有哪些,下面就是实战案例,一起来看一下。
简介
ligerGrid是ligerui系列插件的核心控件,用户可以快速地创建一个美观,而且功能强大的表格,支持排序、分页、多表头、固定列等等。
支持本地数据和服务器数据(配置data或者url)
支持排序和分页(包括Javascript排序和分页)
支持列的“显示/隐藏”
支持多表头
支持固定列
支持明细行
支持汇总行
支持单元格模板
支持编辑表格(三种编辑模式,单元格编辑、行编辑、明细编辑)
支持树表格
支持分组
代码
首先引入基本的css和js文件
<link href="http://www.cnblogs.com/lib/ligerUI/skins/Aqua/css/ligerui-all.css" rel="stylesheet" type="text/css" />
<script src="http://www.cnblogs.com/lib/jquery/jquery-1.5.2.min.js" type="text/javascript"></script>
<script src="http://www.cnblogs.com/lib/ligerUI/js/ligerui.min.js" type="text/javascript"></script>
然后就可以使用liger Grid了
<p id="maingrid"></p>
<script type="text/javascript">
var griddata = [
{ id: '01', name: '部门01' },
{ id: '02', name: '部门02' },
{ id: '03', name: '部门03' },
{ id: '04', name: '部门04' },
{ id: '05', name: '部门05' },
{ id: '06', name: '部门06' },
{ id: '07', name: '部门07' }
];
var grid = $("#maingrid").ligerGrid({
columns: [
{ name: 'id', display: '序号', width: 200 },
{ name: 'name', display: '名称', width: 300 }
],
data: { Rows: griddata }
});
</script>
效果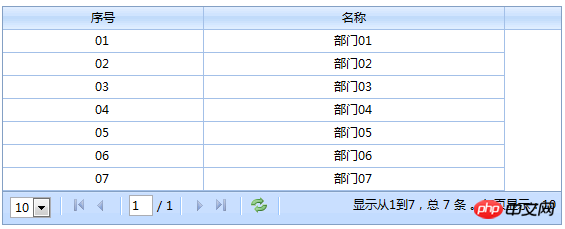
数据结构
表格数据结构
表格数据有两个属性,一个是Rows,一个是Total。其中Rows是一个数据数组,Total是记录的总数。
实则是Total在使用本地数据的时候是不需要提供的。我们使用本地数据的格式可以这样:
{
Rows: [
{ id: '01', name: '部门01' },
{ id: '02', name: '部门02' },
{ id: '03', name: '部门03' },
{ id: '04', name: '部门04' },
{ id: '05', name: '部门05' },
{ id: '06', name: '部门06' },
{ id: '07', name: '部门07' }
]
}id、name都是记录的属性,这里是可以任意自定义的,而在配置columns的时候,并不一定要配置相应的列,只需要配置相应显示的列。在后续的操作中,这些属性都可以取得。比如方法getSelected()。自定义单元格函数render。
树形表格数据结构
树形结构师在表格数据的基础上多了一个children的参数,比如:
{
Rows: [
{ id: '01', name: '部门01', children: [
{ id: '0101', name: '部门0101' },
{ id: '0102', name: '部门0102' },
{ id: '0103', name: '部门0103' }
]
},
{ id: '02', name: '部门02' },
{ id: '03', name: '部门03' },
{ id: '04', name: '部门04' },
{ id: '05', name: '部门05' },
{ id: '06', name: '部门06' },
{ id: '07', name: '部门07' }
]
}两种绑定数据的方式
ligerGrid绑定数据有两种方式,一是使用本地数据,一是使用服务器数据。
在第一个例子中,我们配置了data参数,这种方式是本地方式。另一种方式是配置url参数,使用远程数据。
表格的列提供了很完整的接口可以扩展。无论是内容单元格或者是表头单元格都可以对内容、布局、大小进行自定义。
自定义表头
比如表头,我们可以把display直接设置一段html:
{
display: '<a href="javascript:void(0)">部门</a>', //表头列显示的文本,支持html
name: 'name',
align: 'left'
},或者使用headerRender:
//表头内容自定义函数
headerRender: function (column) {
return "<b>" + column.display + "</b>";
},
效果图 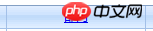
自定义单元格 column的name是定义单元格链接到 行数据 哪一个属性。比如说上面例子的第一行,把name配置为id,那么显示出来应该就是 "01",如果配置成name,那么显示出来就是 "部门01"。还有align参数,是确定单元格的对齐方式。
如果没有配置render,那么单元格显示的内容将由name确定。
{ name: 'id', display: '序号', width: 200 },
{ name: 'name', display: '名称', width: 300 }
上面介绍的是单元格的默认显示方式。除了这种方式,还可以用格式器和自定义函数。
单元格内容的显示规则:
,如果配置了render,使用render
,如果column的type参数扩展了对应的格式化器,那么使用格式化器进行渲染。比如定义了货币格式的格式化器
,最后才是使用默认显示方式
格式化器
通过扩展$.ligerDefaults.Grid.formatters['columntype']来实现,columntype是column配置的type参数。比如现在要格式化一个货币格式的:
$.ligerDefaults.Grid.formatters['currency'] = function (num, column) {
//num 当前的值
//column 列信息
if (!num) return "$0.00";
num = num.toString().replace(/\$|\,/g, '');
if (isNaN(num))
num = "0.00";
sign = (num == (num = Math.abs(num)));
num = Math.floor(num * 100 + 0.50000000001);
cents = num % 100;
num = Math.floor(num / 100).toString();
if (cents < 10)
cents = "0" + cents;
for (var i = 0; i < Math.floor((num.length - (1 + i)) / 3); i++)
num = num.substring(0, num.length - (4 * i + 3)) + ',' +
num.substring(num.length - (4 * i + 3));
return "$" + (((sign) ? '' : '-') + '' + num + '.' + cents);
};
这样只要column的type配置为currency。都会使用这个函数来自定义单元格内容
{ display: '单价', name: 'UnitPrice', align: 'right' ,type:'currency' }效果图
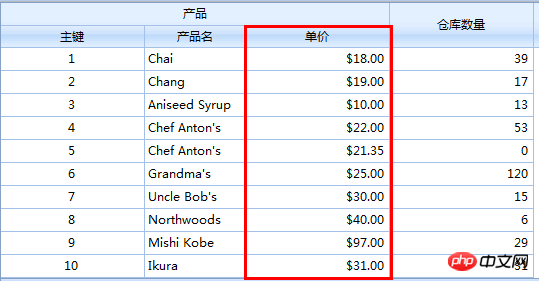
自定义单元格函数
自定义单元格函数是指配置column的render。我们可以组织任意的html。
var grid = $("#maingrid").ligerGrid({
columns: [
{ name: 'id', display: '序号', width: 100,
render: function (record, rowindex, value, column) {
//this 这里指向grid
//record 行数据
//rowindex 行索引
//value 当前的值,对应record[column.name]
//column 列信息
return "<a href='edit.htm?id=" + value + "'>编辑</a>";
}
},
{ name: 'id', display: '序号', width: 120,
render: function (record, rowindex, value, column) {
return '<input type="button" value="Add"/><input type="button" value="Edit"/><input type="button" value="Delete"/>';
}
},
{ name: 'name', display: '名称', width: 300 }
],
data: { Rows: griddata }
});
效果图
单元格编辑器 所有的编辑器的构造的定义在$.ligerDefaults.Grid.editors,比如
editor: { type: 'spinner' }
将会使用$.ligerDefaults.Grid.editors['spinner'] 进行创建编辑器进行构建。
ligerGrid内置提供了 复选框、文本框、日期、数字调整器、下拉框 等编辑器。
效果图 
column的参数很多,这里不作一一列举,只介绍了几个常用的参数
更多的可以查看api: http://api.ligerui.com
排序和分页 排序和分页也有两种方式。一种是本地排序和分页。一种是服务器排序和分页。这里只介绍本地的方式。
默认的情况。是启用排序和分页的。如果要取消分页功能,如下:
usePager: false
效果图 
事件和方法
事件
| 事件名 | 参数 | 描述 |
| onAfterAddRow | (e) | 增加行后事件 |
| onAfterBeginEdit | (e) | 开始编辑后事件 |
| onAfterChangeColumnWidth | (column, newwidth) | 改变列宽度事件 |
| onAfterShowData | (data) | 显示完数据事件 |
| onAfterSubmitEdit | (e) | 提交编辑 事件 |
| onBeforeChangeColumnWidth | (column, newwidth) | 验证 改变列宽度 是否通过 |
| onBeforeCheckAllRow | (checked, grid element) | 选择前事件,可以通过return false阻止操作(复选框 全选/全不选) |
| onBeforeEdit | (e) | 编辑前事件 |
| onBeforeShowData | (data) | 显示数据前事件,可以通过reutrn false阻止操作 |
| onBeforeSubmitEdit | (e) | 验证编辑器结果是否通过 |
| onBeginEdit | (e) | 验证 开始编辑 是否通过 |
| onCancelEdit | (e) | 取消编辑 事件 |
| onChangeSort | () | 改变排序事件 |
| onCheckAllRow | (checked, grid element) | 选择事件(复选框 全选/全不选) |
| onCheckRow | (checked, rowdata, rowindex, rowDomElement) | 选择事件(复选框) |
| onContextmenu | (parm, e) | 右击事件 |
| onDblClickRow | (rowdata, rowindex, rowDomElement) | 双击行事件 |
| onDragCol | (node) | 拖动列事件 |
| onError | () | 错误事件 |
| onLoaded | () | 加载完函数 |
| onLoading | () | 加载时函数 |
| onReload | () | 刷新事件,可以通过return false来阻止操作 |
| onSelectRow | (rowdata, rowindex, rowDomElement) | 选择行事件 |
| onSubmit | () | 提交前事件 |
| onSuccess | () | 成功事件 |
| onToFirst | () | 第一页,可以通过return false来阻止操作 |
| onToggleCol | () | 切换列事件 |
| onToLast | () | 最后一页,可以通过return false来阻止操作 |
| onToNext | () | 下一页,可以通过return false来阻止操作 |
| onToPrev | () | 上一页,可以通过return false来阻止操作 |
| onUnSelectRow | (rowdata, rowindex, rowDomElement) | 取消选择行事件 |
例子
var grid = $("#maingrid").ligerGrid({
columns: [
{ name: 'id', display: '序号', width: 200 },
{ name: 'name', display: '名称', width: 300 }
],
data: { Rows: griddata },
onSelectRow: function (rowdata, rowindex) {
//行记录 对于数据行
//行索引 第几行,从0开始
alert(rowdata.name);
}
});
grid.bind('SelectRow', function (rowdata, rowindex) {
//this 这里的this都是指向grid
//行记录 对于数据行
//行索引 第几行,从0开始
alert(rowdata.name);
});
方法
| 方法 | 参数 | 描述 |
| addEditRow | (rowdata) |
|
| addRow | (rowdata, rowParm, isBefore, parentRow) |
|
| addRows | (rowdataArr) |
|
| appendRow | (rowData, targetRow, nearRow, isBefore) |
|
| beginEdit | (rowParm) |
|
| cancelEdit | (rowParm) |
|
| changeHeaderText | (columnparm, headerText) |
|
| changePage | (ctype) |
|
| changeSort | (columnName, sortOrder) |
|
| collapse | (targetRow) |
|
| collapseDetail | (rowParm) |
|
| deleteRow | (rowParm) |
|
| deleteSelectedRow | () |
|
| demotion | (targetRow) |
|
| endEdit | (rowParm) |
|
| expand | (targetRow) |
|
| extendDetail | (rowParm) |
|
| formatRecord | (record) |
|
| getAdded | () |
|
| getCheckedRowObjs | () |
|
| getCheckedRows | () |
|
| getChidren | (rowParm) |
|
| getColumn | (columnpam) |
|
| getColumns | (columnLevel) |
|
| getColumnType | (columnname) |
|
| getData | (status, removeStatus) |
|
| getDeleted | () |
|
| getParent | (rowParm) |
|
| getRowObj | (rowParm) |
|
| getSelected | () |
|
| getSelectedRow | () |
|
| getSelectedRowObj | () |
|
| getSelectedRowObjs | () |
|
| getSelectedRows | () |
|
| getSelecteds | () |
|
| getUpdated | () |
|
| hasChildren | (rowParm) |
|
| isLeaf | (rowParm) |
|
| isTotalSummary | () |
|
| loadData | (loadDataParm) |
|
| loadServerData | (param, clause) |
|
| reRender | (e) |
|
| setColumnWidth | (columnparm, value) |
|
| setOptions | (parms) |
|
| SubmitEdit | (rowParm) |
|
| toggle | (targetRow) |
|
| toggleCol | (columnparm, visible) |
|
| updateCell | (cell, value, rowParm) |
|
| updateRow | (newRowData, rowDom) |
|
| upgrade | (targetRow) |
|
例子
<a class="l-button" href="javascript:selectRow(2)">选择行(3)</a>
<a class="l-button" href="javascript:getSelectRow()">获取选择</a>
var grid = $("#maingrid").ligerGrid({
columns: [
{ name: 'id', display: '序号', width: 200 },
{ name: 'name', display: '名称', width: 300 }
]
});
grid.set({ data: { Rows: griddata} });
function selectRow(index) {
grid.select(index);
}
function getSelectRow() {
var rows = grid.getSelecteds();
for (var i in rows) {
alert(rows[i].name);
}
}相信看了本文案例你已经掌握了方法,更多精彩请关注php中文网其它相关文章!
推荐阅读:
The above is the detailed content of jQuery LigerUI operation form. For more information, please follow other related articles on the PHP Chinese website!

Hot AI Tools

Undresser.AI Undress
AI-powered app for creating realistic nude photos

AI Clothes Remover
Online AI tool for removing clothes from photos.

Undress AI Tool
Undress images for free

Clothoff.io
AI clothes remover

Video Face Swap
Swap faces in any video effortlessly with our completely free AI face swap tool!

Hot Article
Hot Tools

Notepad++7.3.1
Easy-to-use and free code editor

SublimeText3 Chinese version
Chinese version, very easy to use

Zend Studio 13.0.1
Powerful PHP integrated development environment

Dreamweaver CS6
Visual web development tools

SublimeText3 Mac version
God-level code editing software (SublimeText3)
Hot Topics


 Steps to adjust the format of pictures inserted in PPT tables
Mar 26, 2024 pm 04:16 PM
Steps to adjust the format of pictures inserted in PPT tables
Mar 26, 2024 pm 04:16 PM
1. Create a new PPT file and name it [PPT Tips] as an example. 2. Double-click [PPT Tips] to open the PPT file. 3. Insert a table with two rows and two columns as an example. 4. Double-click on the border of the table, and the [Design] option will appear on the upper toolbar. 5. Click the [Shading] option and click [Picture]. 6. Click [Picture] to pop up the fill options dialog box with the picture as the background. 7. Find the tray you want to insert in the directory and click OK to insert the picture. 8. Right-click on the table box to bring up the settings dialog box. 9. Click [Format Cells] and check [Tile images as shading]. 10. Set [Center], [Mirror] and other functions you need, and click OK. Note: The default is for pictures to be filled in the table
 How to set WPS value to automatically change color according to conditions_Steps to set WPS table value to automatically change color according to condition
Mar 27, 2024 pm 07:30 PM
How to set WPS value to automatically change color according to conditions_Steps to set WPS table value to automatically change color according to condition
Mar 27, 2024 pm 07:30 PM
1. Open the worksheet and find the [Start]-[Conditional Formatting] button. 2. Click Column Selection and select the column to which conditional formatting will be added. 3. Click the [Conditional Formatting] button to bring up the option menu. 4. Select [Highlight conditional rules]-[Between]. 5. Fill in the rules: 20, 24, dark green text with dark fill color. 6. After confirmation, the data in the selected column will be colored with corresponding numbers, text, and cell boxes according to the settings. 7. Conditional rules without conflicts can be added repeatedly, but for conflicting rules WPS will replace the previously established conditional rules with the last added rule. 8. Repeatedly add the cell columns after [Between] rules 20-24 and [Less than] 20. 9. If you need to change the rules, you can just clear the rules and then reset the rules.
 How to make a table for sales forecast
Mar 20, 2024 pm 03:06 PM
How to make a table for sales forecast
Mar 20, 2024 pm 03:06 PM
Being able to skillfully make forms is not only a necessary skill for accounting, human resources, and finance. For many sales staff, learning to make forms is also very important. Because the data related to sales is very large and complex, and it cannot be simply recorded in a document to explain the problem. In order to enable more sales staff to be proficient in using Excel to make tables, the editor will introduce the table making issues about sales forecasting. Friends in need should not miss it! 1. Open [Sales Forecast and Target Setting], xlsm, to analyze the data stored in each table. 2. Create a new [Blank Worksheet], select [Cell], and enter [Label Information]. [Drag] downward and [Fill] the month. Enter [Other] data and click [
 Do you know how to sum a Word table?
Mar 21, 2024 pm 01:10 PM
Do you know how to sum a Word table?
Mar 21, 2024 pm 01:10 PM
Sometimes, we often encounter counting problems in Word tables. Generally, when encountering such problems, most students will copy the Word table to Excel for calculation; some students will silently pick up the calculator. Calculate. Is there a quick way to calculate it? Of course there is, in fact the sum can also be calculated in Word. So, do you know how to do it? Today, let’s take a look together! Without further ado, friends in need should quickly collect it! Step details: 1. First, we open the Word software on the computer and open the document that needs to be processed. (As shown in the picture) 2. Next, we position the cursor on the cell where the summed value is located (as shown in the picture); then, we click [Menu Bar
 How to switch tables horizontally and vertically in word
Mar 20, 2024 am 09:31 AM
How to switch tables horizontally and vertically in word
Mar 20, 2024 am 09:31 AM
Word software is indispensable to us and needs to be used frequently. I have learned how to edit tables using Word software before. However, if I accidentally edit the table in the horizontal and vertical directions, and I don’t want to waste time re-creating it, is it possible to change the horizontal and vertical directions of the table? Woolen cloth? The answer is of course yes. Next, the editor will introduce to you in detail how to swap tables horizontally and vertically in Word. Let us learn together. First, we need to swap the rows and columns of the Word table below. To do this, we need to first select the table entirely, then right-click and select the copy function. Step 2: After selecting copy, we minimize word, then open an Excel table, right-click, select paste, and paste it into Exc
 How to use PUT request method in jQuery?
Feb 28, 2024 pm 03:12 PM
How to use PUT request method in jQuery?
Feb 28, 2024 pm 03:12 PM
How to use PUT request method in jQuery? In jQuery, the method of sending a PUT request is similar to sending other types of requests, but you need to pay attention to some details and parameter settings. PUT requests are typically used to update resources, such as updating data in a database or updating files on the server. The following is a specific code example using the PUT request method in jQuery. First, make sure you include the jQuery library file, then you can send a PUT request via: $.ajax({u
 What are the tips for novices to create forms?
Mar 21, 2024 am 09:11 AM
What are the tips for novices to create forms?
Mar 21, 2024 am 09:11 AM
We often create and edit tables in excel, but as a novice who has just come into contact with the software, how to use excel to create tables is not as easy as it is for us. Below, we will conduct some drills on some steps of table creation that novices, that is, beginners, need to master. We hope it will be helpful to those in need. A sample form for beginners is shown below: Let’s see how to complete it! 1. There are two methods to create a new excel document. You can right-click the mouse on a blank location on the [Desktop] - [New] - [xls] file. You can also [Start]-[All Programs]-[Microsoft Office]-[Microsoft Excel 20**] 2. Double-click our new ex
 How to insert automatic numbering or serial numbers into Word tables
Mar 20, 2024 am 09:30 AM
How to insert automatic numbering or serial numbers into Word tables
Mar 20, 2024 am 09:30 AM
When we make tables, the first thing we think of is to use Excel software to make tables. But did you know that Word software is actually very convenient to make tables. Sometimes when we make tables in Word software, we need to enter serial numbers or numbers. , if you enter them one by one manually, it will be very troublesome. In fact, there is an operation in the word software that can automatically insert numbers or serial numbers. So let’s learn with the editor how to insert automatic numbering or serial numbers into Word tables. . 1. First create a Word document and insert a table. 2. Select the column or cell where you want to insert automatic serial numbers or numbers. 3. Click "Start" - "Number". 4. Select one of the style numbers. 5.
